TPT
Total:
$0.00

2nd Grade Math Anchor Charts

Rated 4.79 out of 5, based on 38 reviews
4.8 (38 ratings)
;
Math with Ms Morrison
29 Followers
Grade Levels
2nd
Subjects
Standards
Formats Included
  • PDF
$2.00
$2.00
Share this resource
Report this resource to TPT
Math with Ms Morrison
29 Followers

What educators are saying

This resource was great for me to use for some of my low kiddos. I was able to go back and review with them using these charts.
I print these out with the poster maker and it saves me time because I dont have to create and design anchor charts for math. These were aligned to Eureka Math

Description

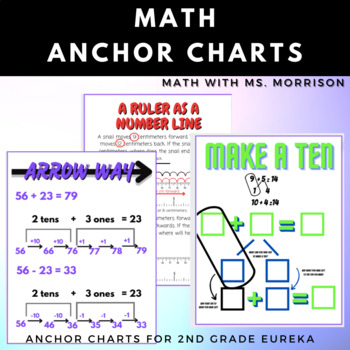
These anchor charts cover a variety of second grade math topics.

Some anchor charts provide helpful information and others are interactive anchor charts for students to complete and keep as an example.

Module 1: Quick Tens and Ones, Make a Ten, Take a Ten

Module 2: Tools to measure, Measure Accurately, Ruler as a Numberline

Module 3: Place Value Chart, Numbers in Different Forms, More Than 10 Tens, Comparing Numbers, 10 More 10 Less 1 More 1 Less

Module 4: Arrow Way, Two Bar Tape Diagram

Module 5: Bundling, Unbundling

Module 6: Equal Groups, Arrays

Module 7: Counting Coins, Bar Graphs

Module 8: Fractions, Shapes, Clocks

A total of 25 anchor charts!

They align well to specific math curriculums (Engage NY,Eureka).

Tags: EngageNY, Math, Anchor Charts, Templates

Total Pages
Answer Key
N/A
Teaching Duration
N/A
Report this resource to TPT
Reported resources will be reviewed by our team. Report this resource to let us know if this resource violates TPT’s content guidelines.

Standards

to see state-specific standards (only available in the US).
Measure the length of an object by selecting and using appropriate tools such as rulers, yardsticks, meter sticks, and measuring tapes.
Tell and write time from analog and digital clocks to the nearest five minutes, using a.m. and p.m.
Draw a picture graph and a bar graph (with single-unit scale) to represent a data set with up to four categories. Solve simple put-together, take-apart, and compare problems using information presented in a bar graph.
Understand that the three digits of a three-digit number represent amounts of hundreds, tens, and ones; e.g., 706 equals 7 hundreds, 0 tens, and 6 ones. Understand the following as special cases:
Read and write numbers to 1000 using base-ten numerals, number names, and expanded form.

Reviews

Questions & Answers