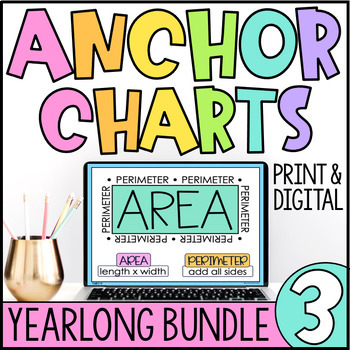
3RD GRADE MATH ANCHOR CHART BUNDLE | DIGITAL | STANDARDS-BASED
- Google Drive™ folder

What educators are saying
Products in this Bundle (5)
Bonus
Description
TRANSFORM your math instruction with these versatile anchor charts! This yearlong bundle includes 131 standards-based anchor charts to help you dig deeper into each standard as you support your students through the year. Easy to print, project or use digitally, these are the perfect tool to help you streamline your instruction.
Included in the bundle:
- 46 anchor charts to support 3.OA (Operations and Algebraic Thinking)
- 36 anchor charts to support 3.NBT (Numbers and Operations in Base Ten)
- 18 anchor charts to support 3.NF (Numbers and Operations - Fractions)
- 17 anchor charts to support 3.MD (Measurement and Data)
- 14 anchor charts to support 3.G (Geometry)
Each anchor chart comes in 4 different formats:
- Printable color pdf
- Printable black & white pdf
- Digital
- Editable template (the headers and colors are not editable)
Your students will feel comfortable and confident trying new math skills. You’ll be amazed as you watch your students become more focused on each standard and feel pride in their growth. Your students’ families will love these, too!
The anchor charts are color-coded by domain to make prep quick and easy. Print the ready-made pages, link digital options or edit the templates to make them your own.
These anchor charts are perfect for:
- Guiding your instruction
- Introducing new topics
- Printing for your classroom math board
- Creating math notebooks, paper and digital
- Linking to digital assignments
- Projecting during student work time
- Small group instruction
- Quick reminders
- Spiral review
- Differentiation
- Previous learning bulletin boards
- Scaffolds as students work towards independence
- Parent communication
- Allowing students to create their own anchor charts using the editable templates
These charts have transformed the way I teach math and have become the center of my math instruction! They're truly a resource you will use again and again.
TEACHERS LOVE THIS RESOURCE:
⭐⭐⭐⭐⭐ Shelby D. says, “LOVE!!! LOVE!!! LOVE!!! These are the best, cutest and my favorite anchor charts I have ever purchased! I love the fonts, colors, and details. I love that they come in PDF and digital. I plan on using them on bulletin boards and for students notebooks!!”
⭐⭐⭐⭐⭐ Victoria C. says, “LOVE these anchor charts! I love that there are multiple options for each so you can choose what works best for your classroom and the charts break things down step by step for the students in an easy way. I used these as notebook inserts and they were able to continue referencing them throughout the year!”
⭐⭐⭐⭐⭐ Kylie D. says, “LOVE this resource! There are so many terms in math, and so many things to remember. I can print these out ahead of time and have them displayed during the unit. Later I can have them displayed in a group for year-round usage."
⭐⭐⭐⭐⭐ Samantha H. says, “I absolutely love these posters! They are great to use on my math board. The kids will go back and read them to refresh. I also print some of them small for them to glue in their math notebooks. Thank you so much for all of your hard work on these!”
⭐⭐⭐⭐⭐ Sweet Life in Third says, “LOVE these anchor charts! They are great for my students to refer back to and for parents to see the strategies and skills we are working on. “
__________________________________________________________
MORE RESOURCES YOU’LL LOVE:
__________________________________________________________
Copyright ©Cooties and Cuties
All rights reserved by the author.
Permission to copy for single classroom use only.
********************************************************************************************


