TPT
Total:
$0.00

3rd Grade Math Posters and Exit Tickets Bundle

Rated 4.86 out of 5, based on 239 reviews
4.9 (239 ratings)
;
The Stellar Teacher Company
21.4k Followers
Grade Levels
3rd
Subjects
Standards
Formats Included
  • Zip
Pages
435 pages
$9.50
List Price:
$11.50
You Save:
$2.00
Bundle
$9.50
List Price:
$11.50
You Save:
$2.00
Bundle
Share this resource
Report this resource to TPT
The Stellar Teacher Company
21.4k Followers

What educators are saying

Great bundle that has explicitly explained examples to aid in student's understanding of math topics. The Exit tickets are very helpful and a time saver!
Great options for anchor charts. Mathematical language was easy for my students to understand. The posters were used all year long.

Products in this Bundle (2)

    Description

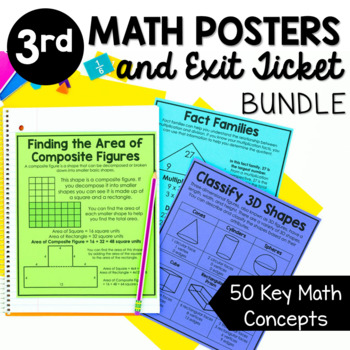
    Get two of the most essential 3rd grade math resources in a great money saving bundle. This bundle includes 60 exit tickets and 50 anchor charts to help you teach and assess some of the most important 3rd grade math skills.

    3rd Grade Math Posters:

    This product includes 50 math posters. Each provides an explanation and example of a key math concept. These posters serve as a great anchor to any lesson and are an excellent reference for students throughout the year. Posters are aligned to the 3rd Grade Texas Essential Skills and Knowledge, but also cover most Common Core State Standards for third grade as well. Posters cover an entire year's worth of content.

    This product includes 6 formatting options to meet your printing needs.

    -black and white full page posters

    -color full page posters

    -black and white mini posters

    -color mini posters

    -black and white journal size posters

    -color journal size posters

    The full size posters are on an 8.5x11 sheet of paper and are great to post in the room in lieu of anchor charts.

    The journal size posters fit perfectly in a standard composition notebook.

    The mini anchor charts come four to a page and are great to put on a ring for easy reference or for students to put in journals if you want to save space.

    3rd Grade Math Exit Tickets

    This product includes 60 exit tickets. Each exit ticket has 3 questions that focus on a specific math skill that will help you quickly assess your students's level of understanding and mastery.

    These exit tickets can be used as a pre-assessment, diagnostic, exit ticket, or as a tool to help identify students that need to be pulled in a small group.

    The exit tickets cover 60 skills commonly taught in 3rd grade. They are aligned to the Texas TEKS, but hit most of the common core skills as well and can be used in 4th and 5th grade as a way to help review and extend students math foundation.

    ________________________________________________________________

    Copyright © The Stellar Teacher Co. LLC

    www.stellarteacher.com

    Permission to copy for single classroom use only.

    Please purchase additional licenses if you intend to share this product.

    Total Pages
    435 pages
    Answer Key
    Included
    Teaching Duration
    N/A
    Report this resource to TPT
    Reported resources will be reviewed by our team. Report this resource to let us know if this resource violates TPT’s content guidelines.

    Standards

    to see state-specific standards (only available in the US).
    Tell and write time to the nearest minute and measure time intervals in minutes. Solve word problems involving addition and subtraction of time intervals in minutes, e.g., by representing the problem on a number line diagram.
    Measure and estimate liquid volumes and masses of objects using standard units of grams (g), kilograms (kg), and liters (l). Add, subtract, multiply, or divide to solve one-step word problems involving masses or volumes that are given in the same units, e.g., by using drawings (such as a beaker with a measurement scale) to represent the problem.
    Draw a scaled picture graph and a scaled bar graph to represent a data set with several categories. Solve one- and two-step “how many more” and “how many less” problems using information presented in scaled bar graphs. For example, draw a bar graph in which each square in the bar graph might represent 5 pets.
    Generate measurement data by measuring lengths using rulers marked with halves and fourths of an inch. Show the data by making a line plot, where the horizontal scale is marked off in appropriate units-whole numbers, halves, or quarters.
    Recognize area as an attribute of plane figures and understand concepts of area measurement.

    Reviews

    Questions & Answers