6th Grade Statistics - Game Show Review Game
- PPTX
What educators are saying
Also included in
- These games are the perfect way to review your units throughout the year. My students absolutely love playing jeopardy before their unit tests. The academic conversations among groups deepen knowledge and the game show format increases motivation and engagement. **FULLY EDITABLE** While the games arPrice $22.50Original Price $30.00Save $7.50
Description
This is the perfect way to review your 6th grade statistics unit!
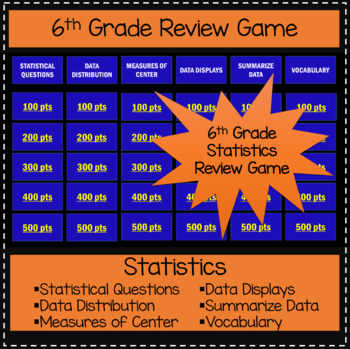
Students will love this Jeopardy-like game to review the Statistics standards. This game is aligned with Common Core standards. Categories include STATISTICAL QUESTIONS, DATA DISTRIBUTION, MEASURES OF CENTER, DATA DISPLAYS, SUMAMRIZE DATA, AND VOCABULARY. Points range from 100 - 500, which reflect the increase in difficulty from 100-point basic review questions to 500-point questions that require students to apply their knowledge.
**FULLY EDITABLE** While the game is complete, it is also editable in PowerPoint, making it easy to add questions or change the level of difficulty based on your students' needs.
STATISTICAL QUESITONS: questions require students to determine whether or not a question is statistical, and identify that variability is required for statistical questions.
DATA DISTRIBUTION: questions cover finding the range, explaining the shape of the data, and the 500 point question asks students to find the mean absolute deviation (MAD).
MEAURES OF CENTER: questions involve finding mean, median, and mode from both lists of data and after looking at various data displays.
DATA DISPLAYS: questions revolve around dot plots, histograms, frequency tables, and box plots.
SUMMARIZE DATA: questions require students to draw conclusions from data, determine possible questions asked, and connect data to different situations.
**Looking for other options? **
6th Grade Review Games BUNDLE – All 6 games for the price of 5!a>
Ratios and Proportional Relationships Game Show Review
Number Systems Game Show Review
Expressions and Equations Game Show Review
6th Grade All Standards Review Game – perfect for state testing and the end of the year!


