TPT
Total:
$0.00

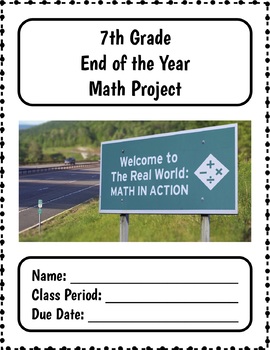
7th Grade MATH End of Year Summative Project + Distance learning

Rated 4.87 out of 5, based on 91 reviews
4.9 (91 ratings)
;
Grade Levels
6th - 8th
Resource Type
Standards
Formats Included
  • PDF
Pages
15 pages
$6.25
$6.25
Share this resource
Report this resource to TPT

What educators are saying

Used with my 5th grade enrichment group. They loved the difficulty. I love that it was print and go.
A great resource to review the year on math. It's difficult to find work after state testing and this resource is perfect for that

Description

****Over 1200 sold! Get this product for cheap while you can!!!*****

This is a great summer school packet as well!

*If you are looking for 6th grade project or a remediation project check out my 6th grade end of year summative project!*

*If you are pre-planning for next year, Check out the discounted Spiraled Common Core 7th Grade Bell Ringers**

Geometric Dream House Project!

After Testing is finished, your students don't want to work on worksheets or regular skill and drill. Instead, they want to be empowered with the opportunity to apply their knowledge in the real world with a fun and engaging multi-day project!

This is a 10 part project that requires little teacher involvement. Students can work in groups or complete individually. This 10 part project includes *every* standard possible in a culturally responsive curriculum that is aligned to Common Core Standards for 7th Grade Mathematics.

This Is a wonderful wrap up to 7th grade material, OR can be used as enrichment of 6th grade standards OR as a remedial activity for 8th grade mathematics.

***Updated with Answer Key***

Part I: Part- Time Job

Standard: 7.NS.A.1.A-d, 7.MS.A.3, 7.NSA.2,a-d

I can add, subtract, multiply and divide rational numbers using real world scenarios.

Part II: Tracking your money

Standard: 7.NS.A.1.A-d, 7.MS.A.3, 7.NSA.2,a-d

I can add, subtract, multiply and divide rational numbers using real world scenarios.

Part III: Order Up!

7.EE.1: I can combine like terms and apply it to real world scenarios

Part IV: Determining the Cost of a Field Trip

7.EE.2: I can solve and apply multi-step equations to real world situations

7.EE.4 I can use variables to represent quantities and inequalities/equations through reasoning

Part V: Inequalities with Real World Application

Directions: Write, Solveand Graphthe inequalities according to the real-world scenarios below.

Standard: 7.EE.3

Part VI: Better Buy Activity:

7.RP.A.1: I can compute Unit Rates associated with ratios of rational numbers.

Part VII: Proportional Relationships

Part VIII: Nike Super Sale

7.RP.A.2 a-d: I can calculate the percent increase, percent decrease, percent off, markup, markdown, sales price, and taxes using real world scenarios.

Part IX: 2020 Election Probability

S.P 5-7

Part X: Student Elections -- Sampling & Measures of Center

SP 1-4

Total Pages
15 pages
Answer Key
N/A
Teaching Duration
2 Weeks
Report this resource to TPT
Reported resources will be reviewed by our team. Report this resource to let us know if this resource violates TPT’s content guidelines.

Standards

to see state-specific standards (only available in the US).
Understand that statistics can be used to gain information about a population by examining a sample of the population; generalizations about a population from a sample are valid only if the sample is representative of that population. Understand that random sampling tends to produce representative samples and support valid inferences.
Use data from a random sample to draw inferences about a population with an unknown characteristic of interest. Generate multiple samples (or simulated samples) of the same size to gauge the variation in estimates or predictions. For example, estimate the mean word length in a book by randomly sampling words from the book; predict the winner of a school election based on randomly sampled survey data. Gauge how far off the estimate or prediction might be.
Informally assess the degree of visual overlap of two numerical data distributions with similar variabilities, measuring the difference between the centers by expressing it as a multiple of a measure of variability. For example, the mean height of players on the basketball team is 10 cm greater than the mean height of players on the soccer team, about twice the variability (mean absolute deviation) on either team; on a dot plot, the separation between the two distributions of heights is noticeable.
Use measures of center and measures of variability for numerical data from random samples to draw informal comparative inferences about two populations. For example, decide whether the words in a chapter of a seventh-grade science book are generally longer than the words in a chapter of a fourth-grade science book.
Understand that the probability of a chance event is a number between 0 and 1 that expresses the likelihood of the event occurring. Larger numbers indicate greater likelihood. A probability near 0 indicates an unlikely event, a probability around 1/2 indicates an event that is neither unlikely nor likely, and a probability near 1 indicates a likely event.

Reviews

Questions & Answers