TPT
Total:
$0.00

7th Grade Review Game | Probability and Statistics Test Prep

Rated 5 out of 5, based on 2 reviews
5.0 (2 ratings)
;
Mrs Padillas Math Class
1.3k Followers
Grade Levels
6th - 9th
Standards
Formats Included
  • Zip
  • Microsoft OneDrive
Pages
25 Questions
$4.98
$4.98
Share this resource
Report this resource to TPT
Mrs Padillas Math Class
1.3k Followers
Compatible with Digital Devices
The Teacher-Author has indicated that this resource can be used for device-based learning.

What educators are saying

Excellent review game! My students were very engaged and the questions were great. Challenging enough that they had to put some effort in, but not too hard that it took them an extended amount of time to work out.
Also included in
  1. This fun, interactive and engaging 7th Grade Review game will have your students asking for more! Expressions and equations, Ratios and proportional relationships, The Number system, Geometry and probability are covered in this bundle. Perfect for end of the unit or end of the year review.Topics i
    Price $24.00Original Price $29.88Save $5.88

Description

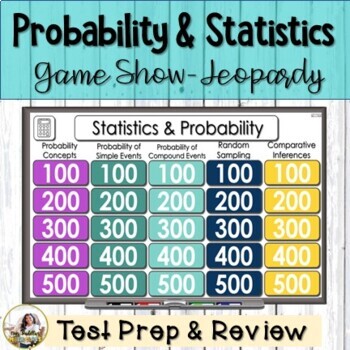
This fun, interactive and engaging 7th Grade probability and statistics Review game will have your students asking for more! Perfect for end of the unit or end of the year review. It can be use as a Jeopardy review game as a whole group, small group activity, or virtual learning.

This NO PREP game is the PERFECT end of the unit on probability and stiatistics. Your students will have the chance to practice exercises on a fun and engaging way while competing with other classmates.

Don’t worry about the animations, scoreboard, and interactive buttons. They are all set for you. You can play this interactive game as a whole group activity while you project it in the board, in small group centers, or even in virtual learning situations while you share your screen!

Includes:

  • Teacher’s Guide & Directions
  • 25 Math Review Question Slides (Interactive PowerPoint)
  • 25 Math Review Answer Slides (Interactive PowerPoint )

There are several ways this game can be used:

  • Whole Group Instruction/Review – Display PowerPoint on Smartboard or classroom screen.
  • Remote Learning – Share the PowerPoint on your screen with your students.
  • Learning Centers – Set up the PowerPoint on a computer or device for students in the center.
  • Test Prep Activity – Since the problems cover the whole unit on expressions, equation and inequalities, this is the PERFECT activity for test prep and review!


Connect with me ⬇

Instagram

Facebook

Pinterest

Follow my TPT

--------------------------------------------------------------------------------------------------------------------------

➯ Be sure to follow my store to be alerted of new products. >> CLICK HERE

➯ Don't forget to leave feedback. You will receive TPT credits (AKA money back) that can be used on future purchases! >> CLICK HERE

Total Pages
25 Questions
Answer Key
Included
Teaching Duration
40 minutes
Report this resource to TPT
Reported resources will be reviewed by our team. Report this resource to let us know if this resource violates TPT’s content guidelines.

Standards

to see state-specific standards (only available in the US).
Understand that statistics can be used to gain information about a population by examining a sample of the population; generalizations about a population from a sample are valid only if the sample is representative of that population. Understand that random sampling tends to produce representative samples and support valid inferences.
Use data from a random sample to draw inferences about a population with an unknown characteristic of interest. Generate multiple samples (or simulated samples) of the same size to gauge the variation in estimates or predictions. For example, estimate the mean word length in a book by randomly sampling words from the book; predict the winner of a school election based on randomly sampled survey data. Gauge how far off the estimate or prediction might be.
Use measures of center and measures of variability for numerical data from random samples to draw informal comparative inferences about two populations. For example, decide whether the words in a chapter of a seventh-grade science book are generally longer than the words in a chapter of a fourth-grade science book.
Understand that the probability of a chance event is a number between 0 and 1 that expresses the likelihood of the event occurring. Larger numbers indicate greater likelihood. A probability near 0 indicates an unlikely event, a probability around 1/2 indicates an event that is neither unlikely nor likely, and a probability near 1 indicates a likely event.
Approximate the probability of a chance event by collecting data on the chance process that produces it and observing its long-run relative frequency, and predict the approximate relative frequency given the probability. For example, when rolling a number cube 600 times, predict that a 3 or 6 would be rolled roughly 200 times, but probably not exactly 200 times.

Reviews

Questions & Answers