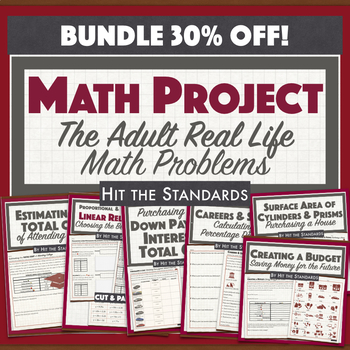
Adult Real-Life Math Problems Project w Google Digital Resource End of Year
- Zip
- Easel Activity
What educators are saying
Products in this Bundle (6)
showing 1-5 of 6 products
Description
Choosing between jobs, buying your first car, creating a budget,... we all go through these situations sooner or later in life. Get your students ready for the adult life with this Math Project were they have to solve real-life math problems! Students get 6 activities:
1 Estimating the Total Cost of Attending College. Students must estimate and compare the costs of different scenarios of attending college.
2 Choosing Between Jobs: Equations, Graphs & Tables of Linear Relationships. Students must analyze different job offers and complete the tables, create a graphs and choose the correct equation that represents each job offer earnings.
3 Purchasing a car: Calculating Down payment, Interest & Total Cost. Students must complete the table by calculating the down payments, interest and total cost of each car.
4 Careers & salaries: Calculating Tax Percentage Deductions. Students must choose the career that they want to pursue and calculate tax deductions based on their income.
5 Purchasing a House: Surface Area of Cylinders & Prisms. Students must calculate the surface area of 3 given houses house and the cost of fixing them.
6 Creating a budget: Administrating andSaving Money for the Future. students must complete a budget table by approximating the sum of their monthly expenses to their monthly net income while saving money.
This resource comes with a digital version in Google Slides with access via Google Classroom. Instructions to upload your resource into your Google Drive account are included.
You can purchase them individually too!
Hits CC Standards 7.G.B.6, 8.EE.B.5, 8.F.B.4 and 8.F.B.5.
TEKS 8.4B, 8.4C, 8.5A, 8.5B, 8.5F, 8.5H, 8.5I, 8.7B, 8.12A, 8.12B, 8.12D, 8.12F and 8.12G.
✔ Excellent for class or homework!
✔ Just print and go!
✔ Answer key included!
☀ Do you want your school to buy this product for you?
Click on this link and send a message to your administrator about TpT for Schools
❤ How to earn TPT credits to use on future purchases:
Please go to your My Purchases page. Beside each purchase you'll see a Provide Feedback button. Simply click it and you will be taken to a page where you can give a quick rating and leave a short comment for the product. You can check your credit balance in your TpT Credit Balance page. Every 100 Credits is worth $5 that you can apply towards future TpT purchases in my store, or any TpT store.
★ Be the first to know about my new products, discounts, and freebies:
Look for the green star next or below to my store logo and click it to become a follower. You’ll receive customized email updates about this store, and be the first to know when new products are added (including FREEBIES!).
✿ Licensing Terms:
Purchase of this unit entitles the purchaser only the right to reproduce the pages in limited quantities for classroom use only. Duplication for an entire school, an entire school system or commercial purposes is strictly forbidden without written permission from the publisher. Licenses are non-transferable and therefore can not be passed from one teacher to another. No part of this resource is to be shared with colleagues or used by an entire team, grade level, school or district without purchasing the correct number of licenses. If you are a coach, principal or district interested in transferable licenses that would accommodate yearly staff changes, please contact me for a transferable license quote at lily_135@hotmail.com.
Copyright Information:
© Erika Hernandez, Hit the Standards.
All rights reserved.
Thank you ❣


