Atmosphere Virtual Lab: Air Pressure & Temperature
- PDF
- Internet Activities
Also included in
- Complete Unit with a hands on approach to teach all about Earth's Atmosphere and Weather. The unit starts with the composition and properties of the atmosphere and the the water cycle followed by lessons about weather - air masses and fronts, air pressure and its affect on the weather, and weatherPrice $36.40Original Price $45.50Save $9.10
- Everything you need to teach students about weather, climate, and climate change. This bundle contains a variety of student centered activities to make the learning real for your students. Engage your students with hands on activities, real world data, group review games, inspiring projects, and gPrice $56.70Original Price $81.00Save $24.30
- Get this year long comprehensive Middle School Earth Science Bundle, designed for teachers looking for effective resources to teach weather, climate, plate tectonics, space science and more! This bundle is perfect for the entire school year, providing a diverse range of activities and experiments tPrice $181.30Original Price $266.25Save $84.95
Description
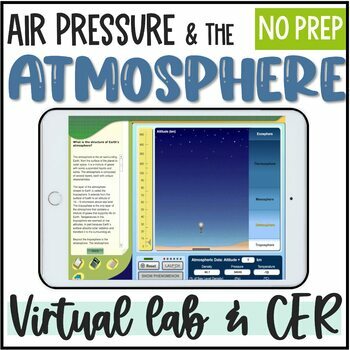
Looking for a no prep activity where students analyze data? In this virtual lab, students collect and analyze data from two digital lab activities about air pressure and temperature in the atmosphere to answer the question: How does altitude affect temperature and air pressure?
After collecting and graphing the data, students read the included passage about air pressure and temperature in the atmosphere to support writing their CER argument to explain how altitude affects temperature and pressure.
Great to support reading comprehension in the science classroom and structured CER writing!!
Ways to Use this Activity:
- This engaging no prep activity is a great way to start a unit about Weather
- Great for data collection to support CER writing
- Easy to use for Sub Plans
This activity includes links to two virtual labs. The first is an interactive virtual lab where students collect and graph data. The second activity was a Flash virtual lab. Since Flash is no longer available, the second activity will follow along with a VIDEO of the virtual experiment to collect the data.
--------------------------------------------------------------------------------------------------------
Want similar products? Check out these additional Atmosphere Lessons:
♥ Energy in the Atmosphere Lab
♥ Earth's Atmosphere Presentation, Notes, and Review
Want to stay up to date on New Products? Follow Me @ Sarah's STEM Stuff


