(BUNDLE) Partitioning Shapes/ 2nd grade & Bar Graphs, Pictographs, Line Plot
- Zip
Products in this Bundle (2)
Description
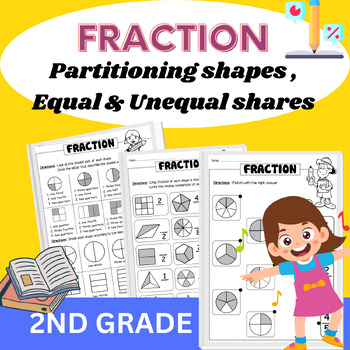
**Fractions and Partitioning Shapes/ 2nd grade Geometry**
This is all about practicing fractions and partitioning 2D shapes! Students learn to partition 2D shapes into two, three, or four equal shares, describe the shares using words like halves, thirds, half of, a third of, etc., and practice identifying equal and unequal shares.
To help students master fractions and partitioning shapes, this package includes different activities:
- Cut out the shapes into fractions.
- Color the shapes that have equal shares.
- Classify shapes into correct groups of equal/unequal shares.
- Color in the fractions.
- Look at the shaded parts and write down the fractions.
- Roll a dice and color the fraction.
We hope you and your students enjoy these activities! Have fun teaching! :)
**Bar Graphs, Pictographs, Line Plots, Tally Graph - Reading charts and Graphs**
Are you looking for a mix of no-prep activities for bar graphs, pictographs, and line plots? This Bar Graph, Pictograph, Tally, and Line Plots pack includes a variety of exercises for practicing reading graphs, showing data, and analyzing data on bar graphs, pictographs, and line plots in no time!
The two main activities, reading graphs and drawing graphs, were designed with different practices to enhance their understanding of working with bar graphs, pictographs, tally, and line plots. There are fun graphing questions, interactive graphs, class graphs, class surveys, group projects, and more! Your students will have so much fun working with them!"
Here are the main activities included:
Bar graph:
- Use the bar graph to answer the questions.
- Record data on the bar graph, and answer the questions.
Pictograph:
- Use the pictograph to answer the questions.
- Draw a pictograph using the data and answer the questions.
Tally
- Use the tally chart and complete the table, answer the questions.
- Count the number, draw a tally to show the count, and write the numeral.
Line plots
- Use the line plots to answer the questions.
- Make the line plots represent the data.
- Read the data, make a line plot, and answer the questions.
These graphing worksheets and activities are perfect for meeting all your data math standards. You can use this resource as whole group work, a math center activity, partner work, or as independent work. Your students will love this fun and engaging resource!
Please take a peek at the preview to see the contents of this unit!
Thank you!


