Bar Graph and Pictograph Math Activities, Graphing Worksheets, Data Project
Amy Lemons
88.8k Followers
What educators are saying
Some very nice activities. My class went around doing a tally and filled out the block graph afterwards.
I love anything that allows my students to learn but stay engaged in hands on learning activities and this resource checked off every box for me. Thank you for the fun and engaging resource for my students.
Description
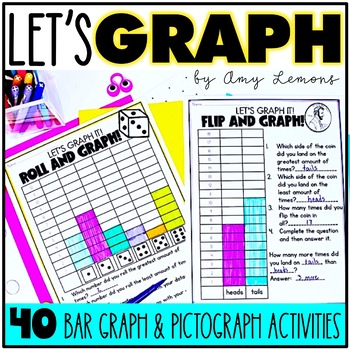
Are you looking for a mix of no-prep bar graphs and pictograph activities? This resource includes bar graph and pictograph posters, worksheets, graphing questions, interactive graphs, class graphs, class surveys, group projects, and more! Your students will be reading graphs and analyzing data in no time!
Here's What is Included:
- 6 Graph Posters
- 9 Graphing Printables- reading and making graphs
- 8 Graph Talks with graphs to display and discuss
- 5 Interactive Graphs with questions
- 10 Class Graphs with graph title, category labels, student cards to graph, bar graph printable, and pictograph printable
- 10 Class Surveys with graph titles and student printables
- Creating Graphs Group Project
- Graph Craft
***Download (not just click to view, but download to your computer and open in Adobe) Preview for a Free Graphing Activity! Or click HERE to view!
Looking for more math units? Check out below:
Total Pages
127 pages
Answer Key
Not Included
Teaching Duration
N/A
Report this resource to TPT
Reported resources will be reviewed by our team. Report this resource to let us know if this resource violates TPT’s content guidelines.
Standards
to see state-specific standards (only available in the US).
CCSS2.MD.D.10
Draw a picture graph and a bar graph (with single-unit scale) to represent a data set with up to four categories. Solve simple put-together, take-apart, and compare problems using information presented in a bar graph.


