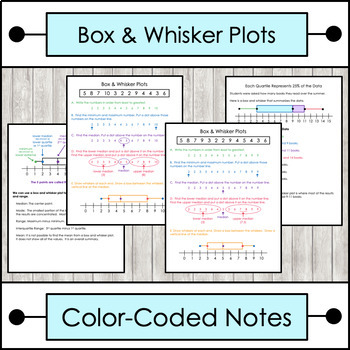
Box and Whisker Plots Notes Color Coded
- PDF
What educators are saying
Description
These colorful notes teach students how to draw a box and whisker plot and interpret it. Each step is color coded to match a part of the picture provided. It provides synonyms for the different points so the students will be familiar with various vocabulary words. Examples: upper quartile or 3rd quartile and upper extreme or maximum. It explains the 5 number summary, how to interpret the box plot, and how to find the median, mode, and range.
If your school does not allow color printing, you can post this to your classroom website.
BONUS: Now included fill-in-the-blank notes! Click on the preview to see all of the option available.
Let's Stay Connected!
It's my goal to create middle school math lessons that reduce math anxiety and encourage students to try. If you are looking to increase student engagement, especially with students who "aren't good at math," I want to support you on their journey to success!
- Follow me on Teachers Pay Teachers
- Follow me on Pinterest
- Follow me on Instagram


