Cold War Map Activity
Smart Apple
658 Followers
Grade Levels
6th - 12th
Subjects
Resource Type
Standards
CCSSRH.6-8.7
CCSSRH.9-10.7
CCSSRH.11-12.7
Formats Included
- Word Document File
Pages
10 pages
Smart Apple
658 Followers
What educators are saying
This is a great way for students to see and understand NATO and the divisions between Communist nations and Democratic nations. One student continually asked, "Why do we care what happens in Ukraine?" This really helped my students visually why we care.
Also included in
- WWII Bundle of nine items that includes:Hitler's Rise to PowerThe Monuments MenCold War Map ActivityWWII Map ActivityWWII DilemmasThe Imitation GameWoman in GoldOperation FinaleThe PianistPrice $12.99Original Price $25.50Save $12.51
- I have created a zipped file with all of my products! You will pay half the price than if you bought them individually! Take a look at all of my products in my store--every single product is included in this zipped file and the vast majority of items are editable! If bought separately, these would tPrice $85.00Original Price $165.49Save $80.49
Description
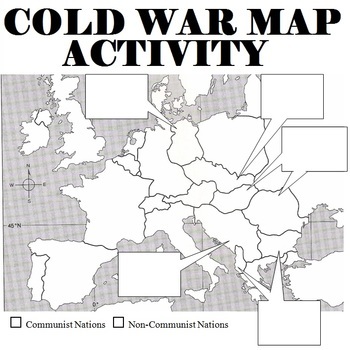
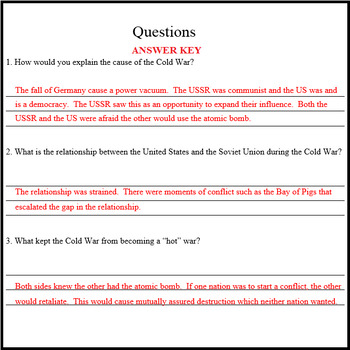
Cold War Map of 1950s Europe and activity. Students are asked to label countries, answer a few questions, and asked to describe how countries fell to communism in the boxes. Students can look up the information in a textbook, online, or use the provided information sheet.
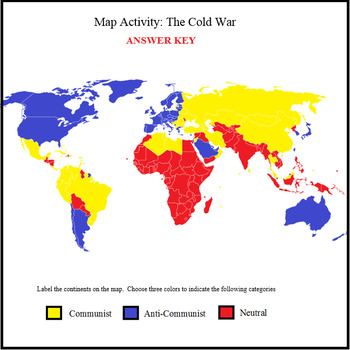
Recently added: A second world map to show aligned and non-aligned counties and five questions.
All items are editable and answer keys are included.
Also available bundled together along with:
Total Pages
10 pages
Answer Key
Included
Teaching Duration
N/A
Report this resource to TPT
Reported resources will be reviewed by our team. Report this resource to let us know if this resource violates TPT’s content guidelines.
Standards
to see state-specific standards (only available in the US).
CCSSRH.6-8.7
Integrate visual information (e.g., in charts, graphs, photographs, videos, or maps) with other information in print and digital texts.
CCSSRH.9-10.7
Integrate quantitative or technical analysis (e.g., charts, research data) with qualitative analysis in print or digital text.
CCSSRH.11-12.7
Integrate and evaluate multiple sources of information presented in diverse formats and media (e.g., visually, quantitatively, as well as in words) in order to address a question or solve a problem.


