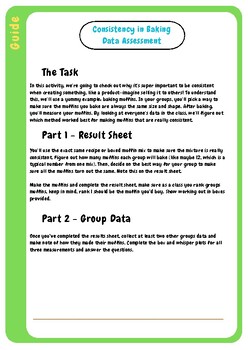
Consistency in Baking: A Data Story
Description
This is a guide on how to use the consistency in baking results & group sheets. This is a statistics assessment:
- 5 number summary
- mean
- range & IQR
- Standard deviation
- box and whisper plots
You don;t need to use this as an assessment but it's a great way to teach the importance of data and how it's useful in a commercial setting.
This practical will also help students understand mean and standard deviation. i find that students know how to calculate mean, median and mode but no matter how many times they do calculations they will never have true understanding of it. This makes it real, they make the data in an authentic way. And if you want teach them standard deviation, it's only a long sum, this gives it meaning because they made it. (only if they know square root etc.) I did this with low achieving year 10, I would do this with year 6 upwards.


