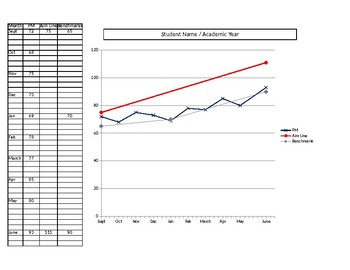
DIBELS Data Graph
What educators are saying
Description
This is a simple, single-page, data table and graph that will show the aim line, progress monitoring, and benchmarks for a student. You enter the beginning benchmark score and the end of the year target on the table and the software will plot this on the graph. You can then enter up to 4 progress monitoring points per month and these will also be plotted on the graph. You can also enter the Benchmark scores for these to be plotted. It makes a easy to read data page with the visual representation of the graph. It is nice for RTi meetings as well as conferences. This is an Excel spreadsheet and is fully customizable. It has separate pages for 20 students. Because you enter your own targets and data it can be used for virtually any progress monitoring or data tracking over time.


