TPT
Total:
$0.00

Data Measures of Central Tendency Posters & Task Cards Mean Median Mode Range

;
Fishyrobb
12.5k Followers
Grade Levels
5th - 7th
Resource Type
Standards
Formats Included
  • Zip
Pages
31 PDF + 16 Digital
$4.00
List Price:
$5.00
You Save:
$1.00
Bundle
$4.00
List Price:
$5.00
You Save:
$1.00
Bundle
Share this resource
Report this resource to TPT
Fishyrobb
12.5k Followers
Easel Activities Included
Some resources in this bundle include ready-to-use interactive activities that students can complete on any device.  Easel by TPT is free to use! Learn more.

Products in this Bundle (2)

    Description

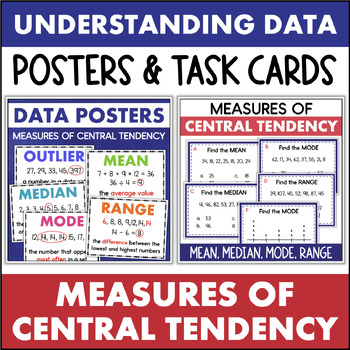
    This math bundle includes two resources to help you teach data and measures of central tendency.

    DATA POSTERS

    Includes 6 clear, simple anchor charts that include a definition and example. Bold fonts make them easy to see from across the room.

    Includes the following measures of central tendency:

    • mean
    • median
    • mode
    • range
    • frequency
    • outlier

    DATA TASK CARDS

    These data task cards are a great way for students to practice analyzing data to find the mean, median, mode, and range!

    There are several types of questions, all addressing measures of central tendency. Some require students to interpret a data set of whole numbers. Others involve data presented in a line plot. The last type of question requires the student to choose the correct method for finding the mean, median, mode, or range.

    Includes:

    • 16 task cards
    • recording sheet
    • answer key
    • digital version with self-checking answers

    The task cards are provided in 1/4-page and full-page size (for group instruction).

    Total Pages
    31 PDF + 16 Digital
    Answer Key
    Included
    Teaching Duration
    N/A
    Report this resource to TPT
    Reported resources will be reviewed by our team. Report this resource to let us know if this resource violates TPT’s content guidelines.

    Standards

    to see state-specific standards (only available in the US).
    Recognize that a measure of center for a numerical data set summarizes all of its values with a single number, while a measure of variation describes how its values vary with a single number.
    Summarize numerical data sets in relation to their context, such as by:
    Giving quantitative measures of center (median and/or mean) and variability (interquartile range and/or mean absolute deviation), as well as describing any overall pattern and any striking deviations from the overall pattern with reference to the context in which the data were gathered.

    Reviews

    Questions & Answers

    12.5k Followers