Data and Statistics (Math 6 Curriculum – Unit 8) | All Things Algebra®
- Zip
- Google Apps™

What educators are saying
Also included in
- Math 6 CurriculumWhat does this curriculum contain? This curriculum includes 685+ pages of instructional materials (warm-ups, notes, homework, quizzes, unit tests, review materials, a midterm exam, a final exam, spiral reviews and many other extras) for Math 6. All answer keys are included. This cPrice $150.00Original Price $224.05Save $74.05
Description
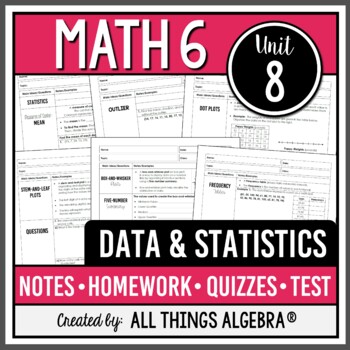
This Data and Statistics Unit Bundle includes guided notes, homework assignments, two quizzes, a study guide, and a unit test that cover the following topics:
• Measures of Center: Mean, Median, and Mode
• Range
• Outliers, Effects on Data, Choosing the Best Center
• Dot Plots
• Stem-and-Leaf Plots
• Quartiles and Interquartile Range
• Box-and-Whisker Plots
• Frequency Tables
• Histograms
• Circle Graphs
• Comparing Multiple Data Displays
ADDITIONAL COMPONENTS INCLUDED:
(1) Links to Instructional Videos: Links to videos of each lesson in the unit are included. Videos were created by fellow teachers for their students using the guided notes and shared in March 2020 when schools closed with no notice. Please watch through first before sharing with your students. Many teachers still use these in emergency substitute situations.
(2) Editable Assessments: Editable versions of each quiz and the unit test are included. PowerPoint is required to edit these files. Individual problems can be changed to create multiple versions of the assessment. The layout of the assessment itself is not editable. If your Equation Editor is incompatible with mine (I use MathType), simply delete my equation and insert your own.
(3) Google Slides Version of the PDF: The second page of the Video links document contains a link to a Google Slides version of the PDF. Each page is set to the background in Google Slides. There are no text boxes; this is the PDF in Google Slides. I am unable to do text boxes at this time but hope this saves you a step if you wish to use it in Slides instead!
This resource is included in the following bundle(s):
More Math 6 Units:
Unit 1 – Whole Numbers and Operations
Unit 2 – Integer Operations
Unit 3 – Rational Numbers
Unit 4 – Expressions and Properties
Unit 5 – Equations and Inequalities
Unit 6 – Proportional Relationships and Percents
Unit 7 – Measurement and Geometry
LICENSING TERMS: This purchase includes a license for one teacher only for personal use in their classroom. Licenses are non-transferable, meaning they can not be passed from one teacher to another. No part of this resource is to be shared with colleagues or used by an entire grade level, school, or district without purchasing the proper number of licenses. If you are a coach, principal, or district interested in transferable licenses to accommodate yearly staff changes, please contact me for a quote at allthingsalgebra@gmail.com.
COPYRIGHT TERMS: This resource may not be uploaded to the internet in any form, including classroom/personal websites or network drives, unless the site is password protected and can only be accessed by students.
© All Things Algebra (Gina Wilson), 2012-present


