TPT
Total:
$0.00

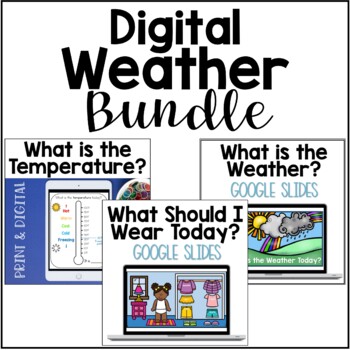
Digital Weather Bundle | Thermometer, Graph & Dress for the Weather

Rated 5 out of 5, based on 12 reviews
5.0 (12 ratings)
;
Centered in Primary
415 Followers
Grade Levels
PreK - 2nd
Resource Type
Standards
Formats Included
  • Zip
  • Google Apps™
Pages
20 Printable & 20 Google Slides
$7.50
List Price:
$9.00
You Save:
$1.50
Bundle
$7.50
List Price:
$9.00
You Save:
$1.50
Bundle
Share this resource
Report this resource to TPT
Centered in Primary
415 Followers
Includes Google Apps™
This bundle contains one or more resources with Google apps (e.g. docs, slides, etc.).

What educators are saying

This really helped my students get a better understanding of the thermometer. They enjoyed getting to dress the characters.

Products in this Bundle (3)

    Description

    These interactive Google Slides activities are perfect for your morning meeting, weather, or calendar time! Great for Kindergarten, 1st Grade & 2nd Grade classrooms, students use the thermometer resource to determine what it feels like outside. Then, they can use the "What Should I Wear Today" activity to dress for the weather! Finally, they can track & discuss the seasons, daily weather, and sunrise and sunset with the weather graph & seasons wheel.

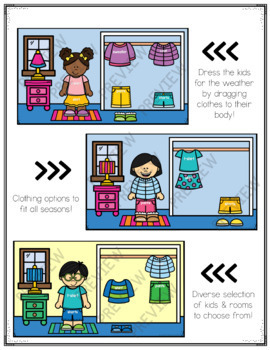
    These resources work perfectly together to add an engaging, fun and purposeful aspect to your weather time. The idea of temperature can be hard for our littlest learners to understand- that's why doing an activity like this can be so helpful! Students learn how to take an abstract idea like temperature, and apply it directly to something they do every morning- get dressed!

    What's Included?

    Weather Thermometer

    • Digital Google Slides Thermometer (Fahrenheit & Celsius)
    • Printable Thermometer (Fahrenheit & Celsius, Color and Black & White)

    What Should I Wear Today?

    • 6 Interactive Google Slide choices (diverse kids, different rooms & clothes)
    • Introduction/Instruction Slide
    • Teacher Instructions & Digital Instructions

    Seasons Wheel & Weather Graph

    • 7 Interactive Google Slides (seasons wheel, weather graph, sunrise & sunset, comparing graph data, weather & season songs)
    • 7 Printable Pages
    • Detailed Teachers Instructions & Digital Instructions

    To see more activities & resources like this, follow my store! And don't forget to leave reviews to earn credits toward future TpT purchases!

    Let's Connect!

    Instagram

    Pinterest

    Digital Products:

    Spell Your Name- Google Slides Activity (All Seasons Bundle)

    Total Pages
    20 Printable & 20 Google Slides
    Answer Key
    Does not apply
    Teaching Duration
    N/A
    Report this resource to TPT
    Reported resources will be reviewed by our team. Report this resource to let us know if this resource violates TPT’s content guidelines.

    Standards

    to see state-specific standards (only available in the US).
    Directly compare two objects with a measurable attribute in common, to see which object has “more of”/“less of” the attribute, and describe the difference. For example, directly compare the heights of two children and describe one child as taller/shorter.
    Organize, represent, and interpret data with up to three categories; ask and answer questions about the total number of data points, how many in each category, and how many more or less are in one category than in another.
    Draw a picture graph and a bar graph (with single-unit scale) to represent a data set with up to four categories. Solve simple put-together, take-apart, and compare problems using information presented in a bar graph.
    NGSSK-ESS2-1
    Use and share observations of local weather conditions to describe patterns over time. Examples of qualitative observations could include descriptions of the weather (such as sunny, cloudy, rainy, and warm); examples of quantitative observations could include numbers of sunny, windy, and rainy days in a month. Examples of patterns could include that it is usually cooler in the morning than in the afternoon and the number of sunny days versus cloudy days in different months. Assessment of quantitative observations limited to whole numbers and relative measures such as warmer/cooler.
    NGSS1-ESS1-2
    Make observations at different times of year to relate the amount of daylight to the time of year. Emphasis is on relative comparisons of the amount of daylight in the winter to the amount in the spring or fall. Assessment is limited to relative amounts of daylight, not quantifying the hours or time of daylight.

    Reviews

    Questions & Answers

    415 Followers