Dot Plots, Histograms, Stem-and-Leaf Plots Digital Pixel Art | Data & Statistics

What educators are saying
Also included in
- Students practice every 6th grade Common Core math standard including place value, decimals, fractions, rational numbers, ratios, rates, percents, expressions, equations, inequalities, geometry, data, and statistics with this 6th Grade Math Digital Pixel Art Bundle. Contains 47 products with 100-pixPrice $99.00Original Price $188.54Save $89.54
- Students practice every 6th, 7th, and 8th grade Common Core State Standards in this Mega 6-8 Grade Math Digital Pixel Art Bundle. Contains 114 products with 245 pixel art Google Sheets thoughtfully grouped into a full-year, CCSS-aligned curriculum for your 6th, 7th, and 8th graders. The bonus file fPrice $249.00Original Price $454.89Save $205.89
- Students practice data & statistics including classifying statistical vs. non-statistical questions, classifying categorical vs. numerical data, identifying shapes of distribution, interpreting data in dot plots, histograms, stem-and-leaf plots, and box plots, measures of center (i.e. mean, mediPrice $17.99Original Price $26.94Save $8.95
- This data and statistics bundle consists of 2 products (3 DIGITAL Pixel Art Google Sheets + 1 PRINT doodle math worksheets activity). Students practice constructing and interpreting dot plots, histograms, and stem and leaf plots. The images are themed after Spring, but is versatile enough that theyPrice $5.99Original Price $8.24Save $2.25
- This data and statistics bundle consists of 6 products (8 DIGITAL Pixel Art Google Sheets + 3 PRINT doodle math worksheet) that will help students practice calculating mean, median, mode, range, interquartile range as well as construct and interpret dot plots, histograms, stem and leaf plots, and bPrice $14.99Original Price $24.47Save $9.48
Description
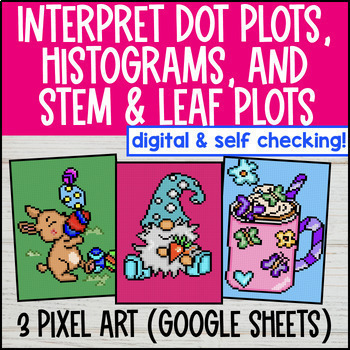
Take interpreting plots practice to the next level with pixel art! Students practice interpreting dot plots, histograms, and stem and leaf plots across 3 pixel art activities with 36 problems total. It's a perfect addition to your data & statistics unit.
These self-checking Google Sheets give students instant feedback. Incorrect answers are highlighted in red, and correct answers turn green and unlock parts of a mystery picture. They’re easy to assign, keep students engaged, and free up your time for differentiation and more.
Save money and time! This activity is in our 6th Grade CCSS-aligned Data & Statistics Digital Pixel Art BUNDLE, which has a full unit of practice.
CCSS Standards: 6.SP.B.4, 6.SP.B.5
What’s included:
- Pixel Art Google Sheet #1: Interpreting dot plots.
- Pixel Art Google Sheet #2: Interpreting histograms.
- Pixel Art Google Sheet #3: Interpreting stem-and-leaf plots.
- Instructions. Know how to assign both with and without Google Classroom.
- Work Space. Optional PDF worksheets that students can use to solve math problems on paper first before typing them in.
- Answer Keys. Included for all activities.
Teaching an introductory lesson?
Check out my corresponding Data & Statistics Guided Notes BUNDLE, which includes guided notes, practice, and real-life applications.
What teachers say about my digital pixel art:
- ⭐️⭐️⭐️⭐️⭐️ “My students love pixel art, it is something they ask for regularly! I used this as practice for our test over mean, median, mode, and range and it worked perfectly. Level 2 was a good challenge as they often struggle with rounding, and this forced them to practice it with accuracy! Thanks!” - Elizabeth O.
- ⭐️⭐️⭐️⭐️⭐️ “This resource was excellent as a self-checking practice of the Pythagorean Theorem. It was just at the right level for grade 8 and the challenge level of the first part (only calculating for the hypotenuse) was good for my IEP students and made them feel as though they could accomplish the same work as their peers.” - Stephanie H.
- ⭐️⭐️⭐️⭐️⭐️ “My students LOVE this pixel art!!! To have them complete them was great!! Never saw the kids so quiet.” - MrsPs Schoolyard
Try my digital pixel art, FREE!
I’ve made two 6th grade digital pixel art activities available free. Download now!
Something not right?
If you have a question, or something is off with the lesson, please email me or post a question on TPT. I’ll do everything I can to make it right.
License
Each license of this product is for one teacher’s classroom and their students. If you wish to share with other teachers, please purchase additional licenses.
The license is non-transferrable. It may only be uploaded to an LMS for that classroom’s students only. Uploading to a shared Google Drive or district server accessible is not permitted. Thank you for supporting my small business!
If you're interested in a quote for a campus or district license, please email me.
Copyright © 2023 Congruent Math LLC. All rights reserved.


