Equation of Line of Best Fit Activity (Hula-Hoop Relay Game)
- Zip
Description
This activity involves playing the hula-hoop relay game as a class to collect data. (You can find videos on youtube for demo/instructions of the game!) Students will use this data to predict how long they think it will take their town to play the game.
The game:
****You will need 1 hula-hoop to play this game!! (I got mine at the dollar store)****
Students will start in a group of 3 and play the game, and someone will record the time it takes to play. Next, you will add another student to the group to create a group of 4 and time it again. And so on, until the entire class is playing (or however many you want!) The goal is to get as many students as possible. If you have a large class you can also add two students at a time instead.
On the worksheet:
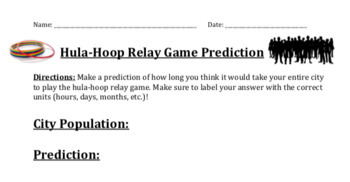
1. Before the activity the students will find the population of their town and make a prediction of how long it would take the town to play. (page 3)
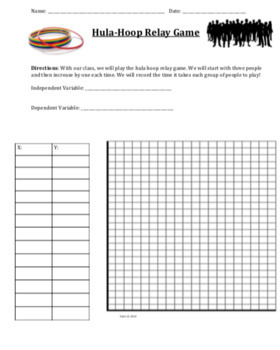
2. Students will identify x and y and then record the data as they play the game. Then they will construct a scatter plot and draw the line of best fit. (page 1)
3. The worksheet guides students on finding the equation of best fit. They will then use this to approximate how long it would take their town to play the game. The last page has critical thinking questions about the activity. (page 2)
This is a great activity that is fun and interesting to collect data, construct scatter plots, answer questions, and find the equation of line of best fit. Students enjoyed this so much! It is a great way to bring the class together and work as a team, as well.
The downloadable file is a zip that includes a 3 page Microsoft Word document and a PDF of the activity. This way you can print it directly or edit it as you please.
Enjoy!


