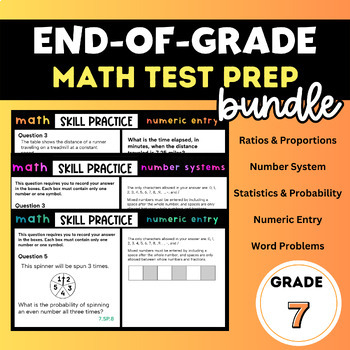
Grade 7 Math EOG Test Prep - Numeric Entry - NS, SP, & RP Bundle
Mastery in Middle
52 Followers
Grade Levels
7th
Subjects
Resource Type
Standards
CCSS7.SP.A.1
CCSS7.SP.A.2
CCSS7.SP.C.5
CCSS7.SP.C.7
CCSS7.SP.C.8
Formats Included
- Google Slides™
Pages
30 pages
Mastery in Middle
52 Followers

Includes Google Apps™
This bundle contains one or more resources with Google apps (e.g. docs, slides, etc.).
Products in this Bundle (3)
Description
Looking for no-prep middle school math end of year test prep? This editable bundle includes thirty EOG-style practice questions to help students prepare for their End-of-Grade assessments. The resources included focus on numeric entry and word problems, two frequently missed areas.
Included:
- Suggested Use
- 10 unique Ratios and Proportions problems (editable)
- 10 unique Statistics and Probability problems (editable)
- 10 unique Number System problems (editable)
- Answer Keys
- A template to add your own problems
Use these to help students prepare for their End-of-Grade testing through daily warm ups, stations, small-group meetings, exit tickets, and academic conversations.
These questions are aligned to the seventh grade standards, but can also be used for high-achieving 6th grade students, or older students who need remediation.
Total Pages
30 pages
Answer Key
Included
Teaching Duration
N/A
Report this resource to TPT
Reported resources will be reviewed by our team. Report this resource to let us know if this resource violates TPT’s content guidelines.
Standards
to see state-specific standards (only available in the US).
CCSS7.SP.A.1
Understand that statistics can be used to gain information about a population by examining a sample of the population; generalizations about a population from a sample are valid only if the sample is representative of that population. Understand that random sampling tends to produce representative samples and support valid inferences.
CCSS7.SP.A.2
Use data from a random sample to draw inferences about a population with an unknown characteristic of interest. Generate multiple samples (or simulated samples) of the same size to gauge the variation in estimates or predictions. For example, estimate the mean word length in a book by randomly sampling words from the book; predict the winner of a school election based on randomly sampled survey data. Gauge how far off the estimate or prediction might be.
CCSS7.SP.C.5
Understand that the probability of a chance event is a number between 0 and 1 that expresses the likelihood of the event occurring. Larger numbers indicate greater likelihood. A probability near 0 indicates an unlikely event, a probability around 1/2 indicates an event that is neither unlikely nor likely, and a probability near 1 indicates a likely event.
CCSS7.SP.C.7
Develop a probability model and use it to find probabilities of events. Compare probabilities from a model to observed frequencies; if the agreement is not good, explain possible sources of the discrepancy.
CCSS7.SP.C.8
Find probabilities of compound events using organized lists, tables, tree diagrams, and simulation.


