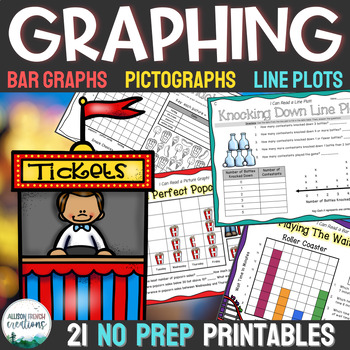
Graphing Worksheets Activity Packet - Pictograph, Line Plot, Bar Graph 3rd Grade
- PDF
What educators are saying
Also included in
- This graphing bundle includes over 40 printable worksheets, a bar graph booklet, bar graph and pictograph templates, a bar graph math craft, and a digital graphing activity with comprehension questions. There are differentiated worksheets that allow teachers to utilize the resources in small group,Price $14.00Original Price $17.50Save $3.50
Description
NO PREP GRAPHING UNIT!
If you're looking for fun, engaging activities to teach your students about bar graphs, pictographs, and line plots...you've found it! This resource is a huge time saver for whole group math time, small group, and independent centers or workstations!
Overview of What's Included (more details below)
Pictographs:
- 3 Read and Respond pictograph worksheets (analyze & interpret data from graph)
- 3 Create and Respond pictograph worksheets (use data to create graph)
Bar Graphs:
- 4 read and respond bar graph worksheets (analyze & interpret data from graph)
- 4 create and respond bar graph worksheets (use data to create graph)
- 1 advanced bar graph worksheet (read article, tally data, create bar graph)
- 1 collect and create bar graph worksheet (collect data from peers & create graph)
Line Plots:
- 3 read and respond line plot worksheets (analyze & interpret data from line plot)
- 2 create and respond line plot worksheets (use data to create line plot)
ANSWER KEYS:
Answer keys are provided
Looking for more? Check out my differentiated graphing unit for even more hands on activities for bar graphs and pictographs!
Check it out
=================================================================
Aligned with the following standards:
Common Core:
CCSS.MATH.CONTENT.2.MD.D.10
CCSS.MATH.CONTENT.3.MD.B.3
Virginia Standards of Learning:
VA SOL 2.9
VA SOL 2.23
VA SOL 3.17
**************************************************************************************************
More info on what's included in this product:
Picture Graphs:
-Picturing Prizes: use a picture graph to complete data table and answer questions
-Picture Perfect Prizes: create a picture graph using cut/glue activity
-Picture Perfect Popcorn Sales (A): use a picture graph to complete data table and answer questions (with challenge question)
-Picture Perfect Popcorn Sales (B): use a picture graph to complete data table and answer questions
- Popping up Popcorn Sales: create a picture graph using clues in the word problem
- Tracking Ticket Sales: create a picture graph using information from the data table
Bar Graphs:
- Fast Freddy's Food Sales: using the story problem and tally marks, create a bar graph to represent the data
- Playing the Waiting Game (Swinging Ship): create a data table based on info from the bar graph. Then answer the questions
- Playing the Waiting Game (Ferris Wheel): create a data table based on info from the bar graph. Then answer the questions
- Playing the Waiting Game Horizontal Bar Graph (Ferris Wheel): create a data table based on info from the bar graph. Then answer the questions
- Playing the Waiting Game (Roller Coaster): create a data table based on info from the bar graph. Then answer the questions
- Playing the Waiting Game (Carousel): create a bar graph using data from the data table. Answer the questions
- Playing the Waiting Game (Bumper Car Colors): create a bar graph using data from the data table. Answer the questions
- Playing the Waiting Game (Favorite Snacks): create a bar graph using data from the data table. Answer the questions
- Round-Up the Snacks: use tally marks to cross off each snack picture. After collecting the data, create a bar graph.
- Round-Up the Votes: students poll their classmates to find out which snack they prefer. After gathering data, they create a bar graph and answer questions.
Line Plots:
-Knocking Down Line Plots (A): read the line plot and complete the data table. Then answer the comparison questions about the data.
-Knocking Down Line Plots (B): read the line plot and complete the data table. Then answer the comparison questions about the data.
-Knocking Down Line Plots (C): read the line plot and complete the data table. Then answer the comparison questions about the data.
-"X" Marks the Spot: use data from the data table to create a line plot. Then answer questions about the data.
- Height Requirements: using information about ride height requirements, complete the line plot and answer the higher order thinking questions.
* Answer Keys Provided *
=================================================================


