Graphing with Skittles Candy Math Activity
- PDF
What educators are saying
Description
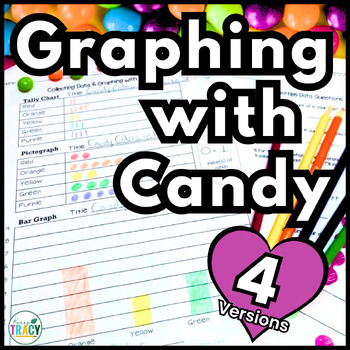
This Valentine's Day graphing activity helps teach/review basic graphing skills: tally marks, bar graphs, pictographs, line plots and answering questions based on data.
It's the perfect Halloween math activity or try it for Valentine's Day math, test review, or any time you need to inject a little excitement into your math lessons.
I usually use Skittles® (because they don't melt) or M&Ms®, but any candies of different colors will do!
The end product is colorful and substantive. I glued their graph page next to "answering questions based on data page" on 12x18 in. construction paper. It looks great hanging on the wall for Open House, Back-to-School Night, or anytime, really!
Students sort candies by color and:
- Create a tally chart
- Create a pictograph
- Create a bar graph
- Create a line plot
- Answer questions related to their data
- Create a question using their data
This download includes:
- Teacher directions
- Four versions of data collection display to choose from (see details in the preview)
- Each version has an option with all labels filled in (titles, x-axis, y-axis, scale) and another option where students fill in all labels
- One student page for using data to answer/create questions
- One bonus student page to create question cards to share with others for extra practice
- An editable file, so you can make adjustments, if you like!
You might also like:


