How I Teach Relating Graphs To Events
Kevin Wilda
558 Followers
Grade Levels
6th - 9th
Subjects
Resource Type
Formats Included
- NOTEBOOK (SMARTboard) File
Pages
25 pages
Kevin Wilda
558 Followers
Description
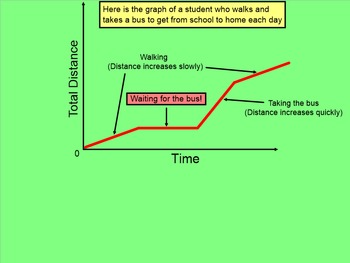
This is a 25 page Smartboard file describing how to graph situation on a coordinate graph according to different events. The lesson describes what situations make a line go up, go down, or stay horizontal. Sometimes the students have to graph the situation and sometimes the students have to write a story that matches a given graph. I also have a worksheet that goes with this.
Total Pages
25 pages
Answer Key
Included
Teaching Duration
2 days
Report this resource to TPT
Reported resources will be reviewed by our team. Report this resource to let us know if this resource violates TPT’s content guidelines.


