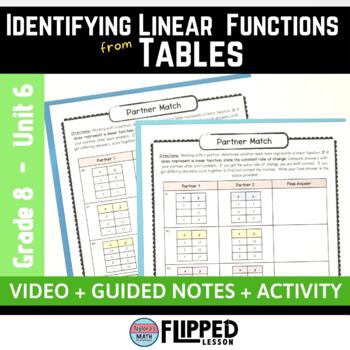
Identifying Linear Functions from TABLES Lesson
- Zip
Description
Are you looking for a COMPLETE lesson to teach identifying linear functions from tables? Students will do just that by finding the constant rate of change! This product is complete with video lesson, guided notes, group activity and more. Great for use as a flipped lesson or mastery learning station!
**Save 20% when you purchase the FULL UNIT!**
OBJECTIVE
Identify a linear function based on the rate of change of a table.
ABOUT
Use this Flipped Lesson in your classroom! Students will watch fill out Guided Notes at home while watching a video lesson. The next day in class, give a Quick Check Assessment and group students appropriately to do the In-Class Activity!
INCLUDED
- lesson plan & implementation guide
- code to access video lesson *(must have access to YouTube)*
- guided notes
- Partner Match Activity - students find the constant rate of change (if any) of several graphs. Each partner works on a DIFFERENT problem but both will arrive at the SAME ANSWER if they are correct!
- answer keys
POSSIBLE USES
- flipped classroom
- independent learning
- remediation groups
- sub plan
**Click here for EVEN MORE problems + extension questions on this topic!**
(Unit 6: Lesson 2)
*************************************************************************************************************
YOU MIGHT ALSO BE INTERESTED IN:
- these FREEBIES
- Flipped Classroom guided notes, activities, task cards, and lessons
- 7th grade and 8th grade worksheets
FOLLOW ME
Follow my store to receive email updates on new items, product launches, and sales!
I'd really appreciate you rating the item after downloading! PLUS you'll receive credits toward future purchases!
TERMS OF USE
Purchase of this product entitles the purchaser the right to reproduce the pages in limited quantities for single classroom use only. Resources may only be posted online if they are behind a password protected site.
©Taylor J's Math Materials, 2018-present


