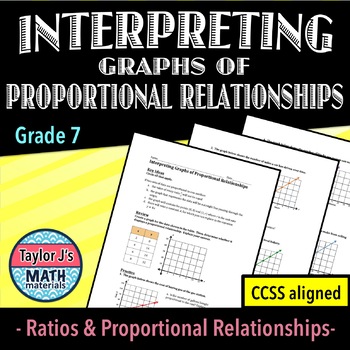
Interpreting Graphs of Proportional Relationships Worksheet
- PDF
- Easel Activity
What educators are saying
Also included in
- Are you working on measuring rate, identifying proportional relationships, using and finding the constant of proportionality? This bundle is LOADED with practice for your students!** SAVE 20% when you purchase the Complete Pack or SAVE 50% when you purchase the Year-Long Bundle**WORKSHEET SECTPrice $9.00Original Price $10.00Save $1.00
Description
What do (0,0) and the point (1, r) mean when looking at a graph displaying a proportional relationship? This worksheet focuses on providing extra practice problems that prompt students to answer this question!
** SAVE 20% when you purchase the Complete Pack or SAVE 50% when you purchase the Year-Long Bundle**
WORKSHEET SECTIONS
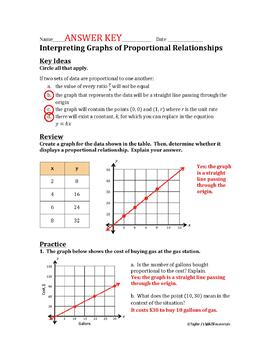
- Key Ideas: review characteristics of proportional relationships
- Review: students graph two sets of data and decide if they are proportional
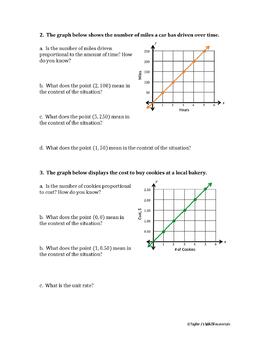
- Practice: Students answer questions about the meaning of points on graphs of proportional relationships leading up to the conclusion that the point (1, r) is the unit rate
POSSIBLE USES:
- bellringers or warm up
- cut up and create stations around your room!
- exit tickets
- homework
- informal assessment
- quiz or test prep
(3 Student Pages; 3 Teacher Pages)
*************************************************************************************************************
YOU MIGHT ALSO BE INTERESTED IN:
- these FREEBIES
- the unit on Rational Numbers
- the unit on Percents & Proportional Relationships
- the unit on Probability and Statistics
or my store for other material to supplement the 7th & 8th grade curriculum!
FOLLOW ME
Follow my store to receive email updates on new items, product launches, and sales!
I'd really appreciate you rating the item after downloading!
TERMS OF USE
Purchase of this product entitles the purchaser the right to reproduce the pages in limited quantities for single classroom use only. Resources may only be posted online if they are behind a password protected site.
©Taylor J's Math Materials, 2018-present


