
Line Plots Worksheets Activities 2nd Grade Read Interpret Graphs Practice Slides


- PDF
- Google Apps™

What educators are saying
Also included in
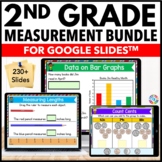 Make measurement practice fun with the interactive activities in this huge 2nd Grade Measurement and Data Digital Worksheets Bundle. With over 230 slides included for all 2nd grade measurement and data skills (counting money, telling time, reading graphs, measuring and comparing lengths, and more),Price $36.80Original Price $44.30Save $7.50
 Supplement your 2nd grade math lessons with these interactive and hands-on digital math review worksheets and activities packets for Google Slides™. This huge bundle of 2nd grade math activities covers all 2nd grade math standards for place value, addition and subtraction, measurement, data, geometrPrice $99.50Original Price $124.30Save $24.80
Description
Engage your students in reading and interpreting graphs with these interactive 2nd Grade Line Plots Worksheets for Google Slides™. While working through these digital line plots activities, your students will practice graphing and interpreting line plots with measurement data. With 20 slides of activities included, you'll have a full supply of ready-to-go practice & review opportunities for your line plots graphing unit!
This 2nd grade line plots with measurements activity works with Google Slides™. Just choose the slides you want to use and assign them to your students. Students love interacting with the movable pieces and typing their responses on these slides!
This resource was designed to support the 2nd grade math standard:
Generate measurement data by measuring lengths of several objects to the nearest whole unit. Show the measurements by making a line plot, where the horizontal scale is marked off in whole-number units.
When you purchase this DIGITAL line plots resource, you'll receive:
- Instructions for opening, sharing, and using this Google Slides™ file
- 20 interactive slides for your students to complete
- Teacher answer key
✅ Want to learn more? Click on the green "Preview" button above!
IMPORTANT: This is a digital resource, so please only purchase this resource if you have the capabilities in your classroom to use it (computers, laptops, or tablets, Internet access, and a Google account).
If you have any issues with this resource, please email me directly at brittney@games4gains.com. I'll be happy to try to help you!
Think ahead and save $$ with a bundle...
- 2nd Grade Measurement & Data Digital Activities Bundle
- 2nd Grade Math Yearlong Digital Activities Bundle
Looking for related digital resources for 2nd grade measurement & data?
- 2nd Grade Reading & Interpreting Bar Graphs
- 2nd Grade Reading & Interpreting Picture Graphs
- 2nd Grade Estimating Lengths
- 2nd Grade Comparing Lengths
- 2nd Grade Solving Measurement Word Problems
Your students may also enjoy:
Customer Tips:
We love to hear what you think! Please leave your feedback on this resource to earn credit points to save money on future purchases!
Click on the green ★ above to follow my store to get notifications of new resources, sales, and freebies!
© Games 4 Gains, LLC.
This purchase is for single-classroom use only. Sharing this resource with multiple teachers, an entire school, or an entire school system is strictly forbidden. Multiple licenses are available at a discount.
