
Linear Equations Graphing Worksheets with Multiple Representations


- PDF
- Easel Activity
What educators are saying
Also included in
 If you enjoy teaching students using discovery learning and engaging activities with real world connections, this huge pack of resources is here to help you plan your entire year of 8th grade math.Lessons help you teach the standards, encourage discussions, and challenge students to think. StudentsPrice $225.00Original Price $386.46Save $161.46
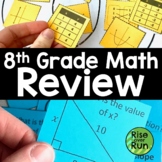 Save yourself 2 weeks of planning time with this pack of engaging 8th grade math review resources for state test prep! I have included some of my favorite and most popular activities that will help your 8th grade math students review the major standards of the year. Material is provided for over 10Price $24.00Original Price $44.50Save $20.50
 Do you love discovery learning, collaboration, hands-on activities, and projects that help students make sense of the math they are learning? This curriculum is packed with engaging and challenging Algebra I and 8th grade math resources for the whole year. A variety of activities, inquiry learningPrice $350.00Original Price $677.94Save $327.94
 Over 30 tasks to engage and challenge your students to deeper thinking. Unlike a worksheet, each task is designed around one main idea. For example, one of the systems tasks revolves around the story of two boys saving money for a bike. This one task requires critical thinking about rates, equatiPrice $20.00Original Price $26.99Save $6.99
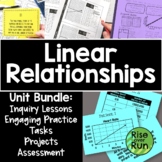 Want linear functions lessons that are engaging to students and have real world applications? This unit is packed with tasks activities to help your students understand graphing linear equations!Included topics:Proportional RelationshipsSlopeSlope-Intercept FormPoint-Slope FormStandard FormThe activPrice $42.00Original Price $58.50Save $16.50
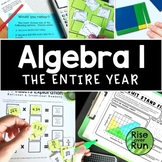 This curriculum bundle includes a variety of activities, assessments, games, group activities, projects, inquiry lessons, guided notes, and more for teaching Algebra I CCSS standards. The activities are centered on discovery learning and engaging activities with real world connections. Lessons helpPrice $225.00Original Price $445.21Save $220.21
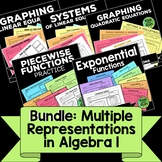 Practice graphing linear functions, systems of linear equations, quadratic functions, exponential functions, and piecewise functions with these engaging activity sheets.Each resource contains multiple task sheets. Each task asks students to complete a story, graph, table of values, and equation basPrice $20.00Original Price $33.00Save $13.00
Description
These activity sheets will help students make connections between linear graphs, equations, tables of values, and the stories they represent. This resource is one of my favorites and best sellers!
Included are 6 different sheets, each with a different scenario and a different representation given. For example, students may be given an equation, and they must fill in a graph to match, missing parts of the story, a table, and identify the initial value and rate of change.
The sheets range in difficulty so you can easily differentiate based on ability.
You will also receive a blank template, so the students (or teacher) can create their own.
All pages are in PDF format. Answer keys are included.
I put these pages in white board sleeves and let the students try different ones with dry erase markers. They then switch and try a new one. The pages could also be used for a week of bell ringers or exit tickets, or just general practice.
