Linear Equations Review Activities | Graphing, Project, Slope-Intercept Form
- Zip

What educators are saying
Products in this Bundle (5)
Description
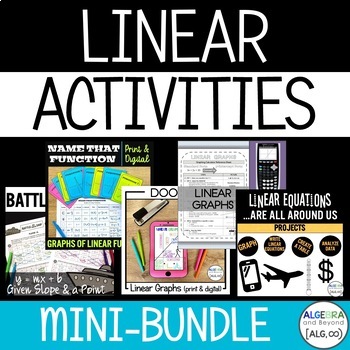
Are your students struggling to grasp the concepts of linear functions? Look no further than this Linear Equations Mini-Bundle – review activities for writing linear equations in slope-intercept form, graphing linear functions from tables, and more! Make the learning process more enjoyable while ensuring effective comprehension. Composed of a diverse set of my best selling linear function resources, this bundle is designed to cater to various learning styles, making the journey reviewing linear equations both captivating and fun!
What's Included (print & digital):
1 - Battle My Math Ship: Write an equation in slope-intercept form given slope and a point
- A fun spin on the game Battleship! Students take turns solving problems to sink their opponent’s ships
- No Prep
- Partner Activity
2 - Name That Function: Graphs of Linear Functions
- Review activity – students use critical thinking skills by analyzing graphs
- Task - students match the graph, based on the characteristics listed
3 - Real World Project: Linear Equations are All Around Us
- Students apply the skills they’ve learned in a real world setting
- 100% Editable Project
- Rubric, Answer Keys, & a Student Sample included
4 - Doodlr: Linear Equations Graph
- Review activity– students make connections with words and symbols through doodling
- Includes a graphic organizer for students to label in relation to real-world scenarios
5 - Graphing Calculator Reference Sheet: Linear Graphs
- Reference Sheet: guides students step by step on how to set the window, find intercepts, and view the table
- Practice Sheet: four problems for students to review what they've learned.
Why Choose this Mini-Bundle:
- Comprehension meets Engagement: The fusion of review activities, visuals, and real-world scenarios ensures that your students not only understand linear equations but also stay engaged throughout the learning journey.
- Adaptability: Whether you're teaching in-person or through virtual platforms, this mini-bundle seamlessly adapts to various teaching environments. The resources are easily accessible both printable and digital, and can be integrated into your curriculum with ease.
- Differentiated Learning: Cater to diverse learning styles and paces with our comprehensive resources.
∞∞∞∞∞∞∞∞∞∞∞∞∞∞∞∞∞∞∞∞∞∞∞∞∞∞∞∞∞∞∞∞∞∞∞∞∞∞∞∞∞∞∞∞∞∞
© Algebra and Beyond
This product is intended for personal use in one classroom only. For use in multiple classrooms, please purchase additional licenses.


