Linear Functions Word Problems: Multiple Representations
- PDF
What educators are saying
Also included in
- This bundle was created specifically for Chris. It contains the following resources:Error AnalysisOrder of OperationsSimplifying Algebraic ExpressionsSolving Multi-Step EquationsSolving Multi-Step InequalitiesSolving Proportions Using the Cross ProductCalculating SlopeGraphing Linear Equations by SPrice $58.20Original Price $97.00Save $38.80
- This bundle contains my most engaging resources and activities that I use to help my students master the 8th grade common core standards. Individually, this bundle would cost $207. SAVE $102 dollars by buying this bundle! Don't need all of these resources? Want to make a custom bundle of just youPrice $105.00Original Price $210.00Save $105.00
Description
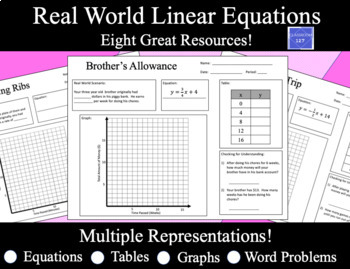
This product is GREAT at having students make connections between real world scenarios, tables, equations written in slope intercept form, and linear graphs!
This product contains eight different resources about different real world scenarios that have a constant rate of change. Information is presented to students in only one of four ways. The four ways that students can be presented with information about the real world situation include
- By a word problem
- By an equation written in slope intercept form
- By a table
- By a linear graph
After receiving information about the real world situation, students must fill in the remaining three ways that the information could have been conveyed. For example, students would be asked to fill in a table, create a graph, and fill in the blanks of a word problem if they were given an equation in slope intercept form. Each of the eight resources will also check for student understanding by asking them two questions about the real world situation that was presented to them.
Four of the resources have a real world scenario that has a positive rate of change. Four of the resources have a real world scenario that has a negative rate of change. It also contains a blank template so that students can create their own scenarios.
Download the preview for more details.
________________________________________________________________________________________________
Do your students need support learning this concept?
Be sure to download Real World Slope Intercept Form Anchor Chart **IT IS FREE**
________________________________________________________________________________________________
And if you like this product, you may also like the following product for when you introduce systems of equations to your students:
Real World: Solving Systems of Equations Word Problems
**Finally, don't forget to rate and comment to earn TPT credits!**


