M&M Statistics Project
Linda Roeder
4 Followers
Description
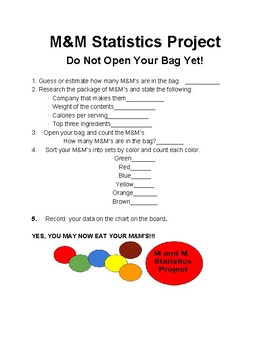
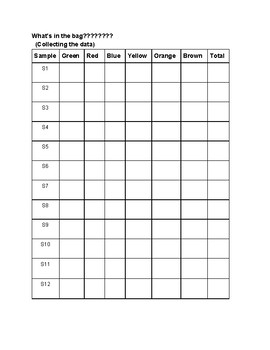
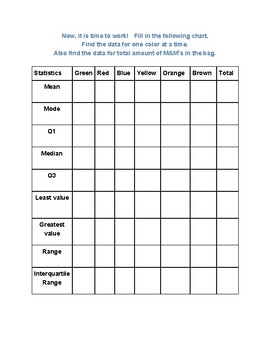
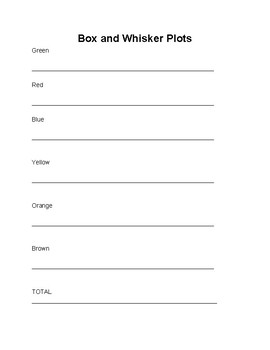
This is a great hands on project for the class that likes to keep active. The students will be given a bag of M&M's and make some predictions. Then data will be collected. Students will then find MEAN, MEDIAN, MODE, THE LOWER QUARTILE, THE UPPER QUARTILE, RANGE, INTERQUARTILE RANGE. Then the students will construct a box and whisker plot with the data. To conclude the project they will compile a powerpoint and include charts from excel or google sheets. A rubric is included for grading.
Total Pages
7 pages
Answer Key
Rubric only
Teaching Duration
4 days
Report this resource to TPT
Reported resources will be reviewed by our team. Report this resource to let us know if this resource violates TPT’s content guidelines.


