Making Predictions from Scatter Plots Activity - Digital & Worksheet
- Google Drive™ folder

What educators are saying
Also included in
- Are you looking for fun 8th grade math activities for the entire year? Get all of my 8th grade math pre-algebra activities and worksheets for a reduced price in this bundle! Your students will be engaged and never bored with the variety that this bundle provides - scavenger hunts, mystery pictures,Price $99.99Original Price $213.00Save $113.01
Description
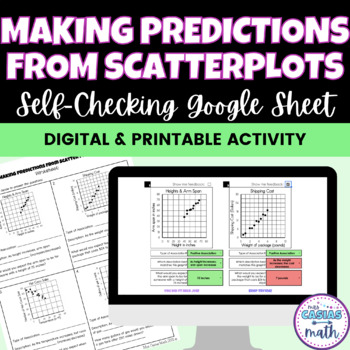
Students love the instant feedback of this self-checking making predictions from scatter plots activity! Students can draw a trend line on the paper worksheet version, or visualize it/hold up a pencil to the computer screen for the digital version. This product includes a google sheet version and a worksheet version with the same scatter plots & questions.
There are 9 linear scatter plots with 3 questions each. The questions are what is the type of association, match a description to the graph, and make a prediction from the graph.
The multi-part questions offer great scaffolding for your students when practicing making predictions from scatter plots. It also helps them (and their teacher!) see exactly where they are going wrong in the problem if they make a mistake.
DIGITAL + PRINTABLE VERSIONS
There is a google sheets version and a worksheet version with the same questions included. You can have all your students do the same version, give them a choice, or have them show their work for the digital activity on the printable worksheet!
This product includes:
● Google Sheets Version - Self-Checking
● Google Sheets Answer Key
● Printable PDF with Worksheet Version and Answer Key
On the google sheets version, students answer three questions on each problem. Once they get all three parts/questions correct, the answer boxes turn green and students are told "Nice job! You did it!". If students do not get all of the statements correct, they are told "keep trying" and the answer boxes remain blue so they can try and figure out their mistake on their own.
Students can check the "show me my feedback" check box if they would like to see the specific answer boxes turn red/green. The red/green feature is not automatic to keep students from guessing. This check box feature can even be deleted if your students are abusing it for guessing. See the preview for a short video of how the google sheets works!
I hope that by providing multiple options, you are able to best fit the needs of your students!
This activity aligns well with TEKS 8.5D and 8.11A.
Related & Similar Resources:
★ Data & Statistics Guided Notes
★ 8th Math Pre-Algebra Guided Notes Bundle
★ Making predictions from Scatter Plots Scavenger Hunt
→ Be sure to follow my store for updates on new products >> CLICK HERE
→ Remember to leave feedback to receive TPT credits for future purchases!
→ Let’s connect! Follow me on INSTAGRAM or email me at mrscasiasmath@gmail.com ☺


