Natural Selection Peppered Moth data analysis
Beverly Biology
603 Followers
Grade Levels
6th - 12th, Homeschool
Subjects
Resource Type
Formats Included
- Zip
Pages
2 pages
Beverly Biology
603 Followers
What educators are saying
I am always looking for ways to bring in graphing and data analysis. This resource fit in perfectly into my natural selection lessons.
My students always struggle with graphing so being able to have an assignment that is linked to the curriculum and makes the data relevent is helpful. The questions apply graph reading skills with is important to strengthen.
Description
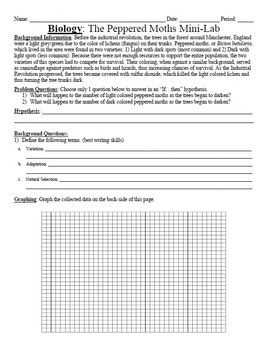
Students will examine data from the historical peppered moth experiment and answer several analysis questions and create a graph of the data. This is a great way to reinforce the concept of natural selection as the population sizes of two Peppered moths increase and decrease as the environment changes.
Three items in this download:
1) Peppered moth analysis (Word)
2) Peppered moth analysis (pdf)
3) Answer key for the peppered moth analysis (Word)
Here are a few other Evolution-based lessons:
Natural Selection Interactive Tutorial
Antibiotic Resistance PowerPoint
Key Words:
Charles Darwin
Natural selection
Artificial selection
Adaptation
Variation
Peppered Moth
Lab analysis
Data analysis
Graphing
Analysis
Problem solving
Total Pages
2 pages
Answer Key
Included
Teaching Duration
30 minutes
Report this resource to TPT
Reported resources will be reviewed by our team. Report this resource to let us know if this resource violates TPT’s content guidelines.


