TPT
Total:
$0.00

One Variable Statistics Review: Analyzing NFL Scores

Rated 5 out of 5, based on 1 reviews
5.0 (1 rating)
;
Math 4 Middles
62 Followers
Grade Levels
8th - 9th
Resource Type
Standards
Formats Included
  • PDF
$3.00
$3.00
Share this resource
Report this resource to TPT
Math 4 Middles
62 Followers

What educators are saying

My students enjoyed using this resource. It was something that was a different way for them to practice the concept.

Description

**UPDATED for the 2022-2023 season!**

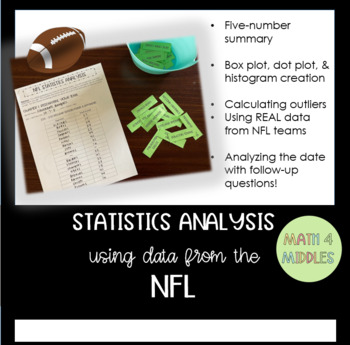
Students are ALWAYS asking "when will I ever see/use this in my life?" This activity provides an opportunity for students to analyze an NFL team's scores from the 2022-2023 regular season. It provides a more engaging way for student to review one-variable statistics and reflect on what they find out about their team.

4 quarters of work included + an "overtime":

  • Quarter 1: Researching your team (record hunting)
  • Quarter 2: Stats analysis (five-number summary, mean, IQR, MAD, standard deviation)
  • Quarter 3: Scores that don't make sense (outliers calculation)
  • Quarter 4: Representing your team (creating dot plot, box plot, and/or histogram with the data found)
  • Overtime: Analyzing your team data questions

You may also like:

One-Variable Statistics: Stations Review

Terms of Use:

This product should only be used by the teacher who purchased it. This product is not to be shared with other teachers. Please buy the correct number of licenses if this is to be used by more than one teacher.

Did you know?

You can receive TPT store credits to use on future purchases by leaving feedback on products you buy! Just click on "My Purchases" under "Buy"!

Connect with me!

Twitter

Instagram

Total Pages
Answer Key
N/A
Teaching Duration
90 minutes
Report this resource to TPT
Reported resources will be reviewed by our team. Report this resource to let us know if this resource violates TPT’s content guidelines.

Standards

to see state-specific standards (only available in the US).
Represent data with plots on the real number line (dot plots, histograms, and box plots).
Use statistics appropriate to the shape of the data distribution to compare center (median, mean) and spread (interquartile range, standard deviation) of two or more different data sets.
Interpret differences in shape, center, and spread in the context of the data sets, accounting for possible effects of extreme data points (outliers).
Use the mean and standard deviation of a data set to fit it to a normal distribution and to estimate population percentages. Recognize that there are data sets for which such a procedure is not appropriate. Use calculators, spreadsheets, and tables to estimate areas under the normal curve.

Reviews

Questions & Answers

62 Followers