Parent Functions Calculation and Graphing Project
- Word Document File
Description
PLEASE NOTE: THE PREVIEW VERSION OF THIS PRODUCT IS THE ACTUAL "STUDENT VERSION" AND DOES NOT INCLUDE ANY OF THE ANSWERS TO THE PROBLEMS. THE PRODUCT VERSION INCLUDES DETAILED ANSWERS TO ALL OF THE PROBLEMS FOR THE PROJECT.
This project activity involves the calculation, graphing and coloring of the twelve (12) basic functions studied in Algebra 2/Math 3 and Pre-Calculus. I have my Algebra 2, Math 3 and Precalculus students complete this project toward the end of the semester/year in preparation for their EOC Test/Final Exam. It is an excellent end of year review on functions and their characteristics. You will see that this project document not only includes the specific material and sheets to complete the project calculations and graphing, but it also includes over ten (10) pages of basic review material and vocabulary associated with functions.
The following twelve (12) functions are covered in this project package:
- Linear Function
- Absolute Value Function
- Exponential Function
- Quadratic Function
- Cubic Polynomial Function
- Quartic Polynomial Function
- Radical (Square Root) Function
- Radical (Cube Root) Function
- Rational Function
- Logarithmic (Base 10) Function
- Trigonometric Sine Function
- Trigonometric Cosine Function
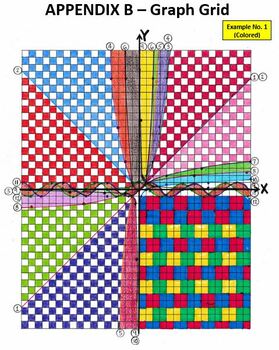
The first project activity involves the completion of a set of X-Y Coordinate Point Tables by the students for each of the 12 functions. These coordinates are then plotted on the included graph grid for each function and a smooth curve drawn for each function. Once the graphs are completed, the students are required to complete a Parent Function Description Sheet for each of the 12 functions.
The students are required to analyze and list the following on each of the description sheets:
- Format of Parent Function
- Format of Transformed Function
- Domain
- Range
- Increasing, Decreasing and Constant Intervals
- Positive, Negative and Neutral Intervals
- End Behavior
- X-Y Intercepts
Once the 12 Parent Function Description Sheets are completed, the required summary information and data from these sheets is transferred to the Parent Function Description Summary Table. The final activity involves coloring the various sections formed by the intersecting lines from each of the plotted function curves on the graph grid to provide an interesting "stained glass effect" final product. It should be noted that an alternative to manual graphing is also provided (i.e., use of the Desmos online graphing calculator) if that is of interest.
This activity can be completed by students working individually; but, given the amount of calculations and graphing involved, I have my students work in pairs or groups of 3 to complete the project in a more timely manner. It usually takes two, 1-1/2 hour class periods to completely finish all parts of the activity when working in groups with some of the final graph coloring also being assigned as homework.
This project activity package is a native MS Word file and includes the following sections and appendices:
- Part A - General Introduction
- Part B - General Vocabulary
- Part C – General Parent Function Characteristics including:
- Domain and Range
- Increasing, Decreasing and Constant Intervals
- Positive, Negative and Neutral Intervals
- End Behavior
- X and Y Intercepts
- Part D – Project Specific Guidelines
- Part E – Grading Rubric
- Appendix A - Student Worksheets including:
- Parent Function X-Y Coordinate Point Tables
- Parent Function Description Sheets
- Parent Function Description Summary Table
- Appendix B - Graph Grid (Blank Copy)
- Appendix C - Grading Rubric
- Appendix D - Teacher Answer Key Material including:
- Parent Function X-Y Coordinate Point Tables
- Parent Function Description Sheets
- Parent Function Description Summary Table , and
- Graph Grid (Example 1 Colored)
- Graph Grid (Example 2 - Uncolored and Colored)
As noted above two (2) completed, sample, colored graph grid examples are also included at the end of the activity package (one manual graph and one online Desmos-generated graph). There are 46 total pages in the package. The native MS Word file is included in the event the teacher desires to make any modifications to the activity to suit her or his classroom purposes.
Other MS PPT products for 6th Grade, 7th Grade, 8th Grade, Math 1, Math 2, Math 3, Algebra 1, Algebra 2, Geometry and PreCalculus curriculum topics can be reviewed and purchased under my TpT page titled: "Priceless Math".


