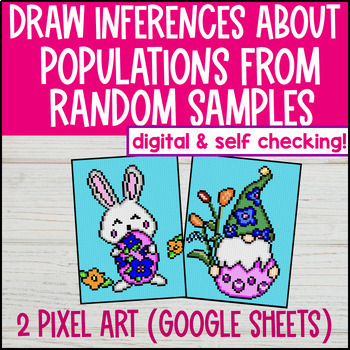
Population Inferences Digital Pixel Art | Random Samples | Statistics 7th Grade

What educators are saying
Also included in
- Students practice every 7th grade Common Core math standard including rational numbers, expressions, equations, inequalities, ratios, rates, proportions, percents, plane geometry, angle relationships, surface area, volume, statistics, and probability with this 7th Grade Math Pixel Art Bundle. ContaiPrice $99.00Original Price $203.50Save $104.50
- Students practice every 6th, 7th, and 8th grade Common Core State Standards in this Mega 6-8 Grade Math Digital Pixel Art Bundle. Contains 114 products with 245 pixel art Google Sheets thoughtfully grouped into a full-year, CCSS-aligned curriculum for your 6th, 7th, and 8th graders. The bonus file fPrice $249.00Original Price $454.89Save $205.89
- This digital and print bundle includes 2 products to practice using data from random sampling to draw population inferences. It is great for use as a sub plan, review lesson, or independent practice. The first product is a 12-pages Guided Notes Lesson while the second product is a set of Digital PixPrice $5.75Original Price $8.24Save $2.49
- Students practice statistics including measures of center (i.e. mean, median, mode), and measures of spread and variability (i.e. range, interquartile range, mean absolute deviations), interpret box and whisker plots, random sampling, population inferences, and comparing populations with this 7th GrPrice $14.99Original Price $21.95Save $6.96
Description
Make random sampling and drawing inferences a blast with this self-checking digital pixel art activity. Includes 2 Google Sheets with 2 separate images. Level 1 making inferences from random sampling word problems, level 2 focuses on drawing inferences from data of random sampling represented in tables. Each correct answer reveals part of three different mystery images perfect for Easter, Spring (or any time in the school year).
Note: This product is part of the 7th grade statistics pixel art bundle. Purchase the bundle for the best deal!
Plus, there’s an optional printable PDF worksheet with work space to allow students to show work on paper if desired. Easy to assign virtual or in-person, and with Google Classroom.
This product covers the common core standard, with a focus on interpreting data and statistics:
7.SP.A.1 Understand that statistics can be used to gain information about a population by examining a sample of the population; generalizations about a population from a sample are valid only if the sample is representative of that population. Understand that random sampling tends to produce representative samples and support valid inferences.
7.SP.A.2 Use data from a random sample to draw inferences about a population with an unknown characteristic of interest. Generate multiple samples (or simulated samples) of the same size to gauge the variation in estimates or predictions.
Includes 2 Google Sheets…
✅ Pixel Art Google Sheet #1: Random Sampling and Drawing Inferences
✅ Pixel Art Google Sheet #2: Drawing Inferences from Data Represented in Tables
✅ Instructions for use with Google Classroom and non-Google-Classroom platforms.
✅ Printable PDF worksheets for students to show work before typing into Google Sheets. (optional)
✅ Answer Key
Great for…
⭐ Spiral Review Lessons
⭐ Emergency Sub Plans
⭐ Homeschool Activities
⭐ Homework & Independent Practice
⭐ Learning Centers & After School Math Programs
⭐ Early Finisher Activities
Reviews for my Pixel Art products…
⭐⭐⭐⭐⭐ Kristy M. - ”My students love mystery pixel art activities and ask for them all the time! This is a great skill practice and students become more independent when using these.”
⭐⭐⭐⭐⭐ Teresa G. - “Great review resource for the beginning of unit, then harder level 2 practice as we moved along, self-checking pixel art helps so much!”
⭐⭐⭐⭐⭐ Carissa S. - “My students love being able to go online to learn once each week! This resource provided much needed additional practice! And my students loved it and were highly engaged.”
Want to save 40%?
Consider a Pixel Art grade level bundle. It's a whole year of review or sub plans:
You might also like…
✴️ 7th grade statistics pixel art bundle
✴️ Mean Median Mode Pixel Art & Doodle Math BUNDLE
✴️ Mean Median Mode Doodle Math, a Twist on Color by Number
✴️ Mean Absolute Deviation (Print Activity- Codebreaker Math Mystery)
✴️ Click here to see more pixel art activities! ___________________________________________ ❤️ Be the first to hear about freebies and products. FOLLOW CONGRUENT MATH.
❤️ Don’t forget to leave a review! TPT will give you credit for future purchases.
Each purchased license is for use in a single classroom. If you’d like to share with other teachers, please buy additional licenses. Thanks!


