Probability Activities: Hands-On Probability with Snacks!
- PDF
Description
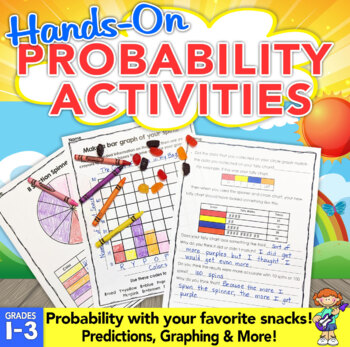
Probability activities are fun and engaging when you add treats! These fun probability activities allow students to experiment with probability using snacks.
Students will use probability to predict, investigate, record data, and learn to use words to describe the chances of something happening.
Students will love these probability activities because they are using skills with snacks! Each of the probability activities builds on each other and guides them step-by-step. Easy prep to print off the probability activity pages or make them into a packet for your students. Of course, it's up to you if students are able to enjoy their snacks at the end!
Your students will love practicing probability concepts using real snacks to engage their learning and motivate them to learn about probability!
The included lesson will take your students through steps of investigating probability by using your favorite goodies like fruit snacks, Skittles, M & Ms, etc.
Students will:
- make predictions
- create graphs
- utilize tally charts to record data
- spinners to experiment with their data
Students will be asked deep, open-ended questions that really get them thinking about probability! Your classroom won't be quiet, but you will love the level of engagement and the probability discussions you will hear going on.
Prep is quick and easy... Just print the student pages, get the materials listed, and you're ready for an engaging and exciting time in math class! Everything is a little more fun with food...especially probability!
See what teachers like you are saying:
⭐️⭐️⭐️⭐️⭐️Suzanne K. says:
I saved this unit until the end of the year. It was engaging for the whole 2nd/3rd-grade class! My volunteer helper is quite a mathematician, and he said it was the best unit on probability he'd seen in quite a while.
⭐️⭐️⭐️⭐️⭐️Exceeding in Reading says:
Amazing ideas! I used fruit snacks because I have already used skittles and candy hearts. I love the thoroughness of the questions. Everything is asked in a way that my students will comprehend and have fun answering. Thanks!
⭐️⭐️⭐️⭐️⭐️Beth B. says:
This is not a boring booklet! My students loved the probability tasks and I loved how well thought out the package was. This was ready to use immediately.
⭐️⭐️⭐️⭐️⭐️Jacqueline R. says:
Well worth the money! The kids love the use of candy as manipulatives. The scaffolding aspect of this project/lesson is great.
⭐️⭐️⭐️⭐️⭐️Brooke B. says:
A valuable product that reinforces probability and graphing. I like that it was generic to use with a variety of different bags of goodies, so it can be repeated for extra exposure at different times throughout the year. :)
You may also like:
Probability Digital Escape Interactive Learning Adventure
See how our probability activities went in my classroom on my blog .
Hilary


