TPT
Total:
$0.00

Probability-Likelihoods & Relative Frequency Boom Cards-Digital Task Cards

;
Grade Levels
7th
Resource Type
Standards
Formats Included
  • Google Slidesâ„¢
  • Internet Activities
$2.50
$2.50
Share this resource
Report this resource to TPT
Made for Google Driveâ„¢
This resource can be used by students on Google Drive or Google Classroom. To access this resource, you’ll need to allow TPT to add it to your Google Drive. See our FAQ and Privacy Policy for more information.

Description

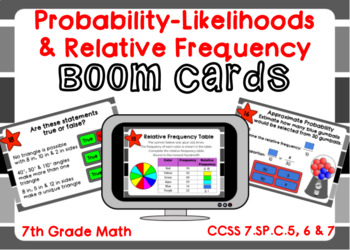
This card set offers scaffolding for classifying the likelihood of events and determining the relative frequency. Students also use the relative frequency to approximate larger outcomes.

20 Questions:

Classify likelihoods with decimals, percents, and scenarios

Match spinners and gumball machines to their likelihoods

Determine relative frequency using decimals and percents

Use relative frequency to approximate larger outcomes

Boom Card Digital Task Cards allow students to check their answers or get help if needed. Boom Cards are self-grading and no prep!

You may be eligible for a free trial from Boom Learning. Read here for details: http://bit.ly/BoomTrial. If you choose not to stay on a premium account after your free trial, you will still be able to assign all your Boom Cards to as many students as you see fit using Fast Play pins (which give instant feedback for decks that are self-grading). You will not be charged when your free trial expires.

Total Pages
Answer Key
N/A
Teaching Duration
N/A
Report this resource to TPT
Reported resources will be reviewed by our team. Report this resource to let us know if this resource violates TPT’s content guidelines.

Standards

to see state-specific standards (only available in the US).
Understand that the probability of a chance event is a number between 0 and 1 that expresses the likelihood of the event occurring. Larger numbers indicate greater likelihood. A probability near 0 indicates an unlikely event, a probability around 1/2 indicates an event that is neither unlikely nor likely, and a probability near 1 indicates a likely event.
Approximate the probability of a chance event by collecting data on the chance process that produces it and observing its long-run relative frequency, and predict the approximate relative frequency given the probability. For example, when rolling a number cube 600 times, predict that a 3 or 6 would be rolled roughly 200 times, but probably not exactly 200 times.
Develop a probability model and use it to find probabilities of events. Compare probabilities from a model to observed frequencies; if the agreement is not good, explain possible sources of the discrepancy.

Reviews

Questions & Answers