Segmented Bar Graph, Side-by-Side Bar Graph, & Mosaic Plot - AP Statistics Notes
- PDF
What educators are saying
Also included in
- AP® Statistics notes on UNIT 2 - EXPLORING TWO-VARIABLE DATA : contingency tables / two way tables, segmented bar graphs, scatterplots / scatter plots, correlation coefficient, linear models, residual plots, linear regression computer output, r-squared, and more! Great for AP® Stats Exam review prepPrice $15.00Original Price $20.00Save $5.00
- 64 PAGES of AP® Statistics Notes! UNITS 1, 2, 3, & 4 - the entire FIRST SEMESTER of AP® Stats! Unit 1 includes histogram, box plot, median, mean, standard deviation, interquartile range, Normal Distribution, z-score... Unit 2 covers two way table, scatterplot, linear model, residual plot, correlPrice $49.00Original Price $71.00Save $22.00
Description
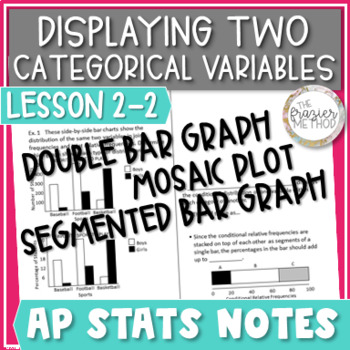
AP Stats Notes on graphing two categorical variables in a SEGMENTED BAR GRAPH, SIDE-BY-SIDE BAR GRAPH, & MOSAIC PLOT! Identify which graph(s) can display joint frequencies, joint relative frequencies, and/or conditional relative frequencies (conditional distribution). Define and distinguish between independent and associated variables. Great for AP Stats Exam review prep!
Aligns with AP College Board's updated 2019-2020 objectives and standards for AP Statistics Unit 2: Exploring Two-Variable Data.
WHAT’S INCLUDED IN THIS PRODUCT?
Lesson 2-2: Displaying Two Categorical Variables Part 2 – Segmented Bar Graph, Side-by-Side Bar Graph, & Mosaic Plot
NOTES – 2 Pages, Blank Pages & Answer Key
TYPES OF PROBLEMS:
In this set of AP Statistics notes, students will learn to:
- Display two categorical variables in a side-by-side bar graph, segmented bar graph, & mosaic plot.
- Answer questions about two categorical variables displayed in a side-by-side bar graph, segmented bar graph, & mosaic plot.
- Determine which type of graph(s) can display joint frequencies, joint relative frequencies, and/or conditional relative frequencies (conditional distribution).
- Define independent and associated variables.
- Determine whether two categorical variables are independent or associated based on a contingency table, side-by-side bar graph, segmented bar graph, and mosaic plot.
Also included to make your Lesson-Planning easier…
- OBJECTIVES
- STANDARDS from updated 2019-2020 AP College Board Standards for AP Statistics Unit 2: Exploring Two-Variable Data.
- SUGGESTED HOMEWORK PROBLEMS from AP Statistics Textbook Stats: Modeling the World, AP Edition, 4e.
- TERMS OF USE for posting on online teaching sites like Blackboard or Moodle.
YOU MAY ALSO LIKE:
AP Statistics Unit 1 Notes Bundle
AP Statistics TI-84 Calculator Functions for the ENTIRE YEAR
AP Statistics Formulas & Vocabulary for the ENTIRE YEAR
Statistics Word Wall – Graphs, Tables, Chart, & Plots Unit 1
Statistics Word Wall – Vocabulary & Formulas Unit 1
Statistics Word Wall – Vocabulary & Graphs Unit 2
SAVE MONEY ON TPT:
Earn TPT credit by reviewing products you buy! Go to "My Purchases" and click “Provide Feedback” next to each product to leave a review. These points add up and can go towards your future purchases! YAY!!!
Thank you for considering my product for purchase!


