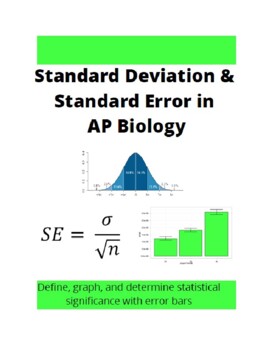
Standard Error and Standard Deviation in AP Biology
Description
Statistics is one of those components in AP Biology that is brand new to students.
Without a proper introductory lesson to standard error and standard deviation, students can struggle with this all year. Fortunately, this lesson truly walks your students through the process of defining standard deviation and error, applying the concept of error bars with statistical analysis, and graphing data with error bars to make their own statistical analysis. A PowerPoint is included as well to guide the lesson for the teacher.
Several biology examples are used so that students can do more than just calculate these statistics. The lesson culminates with students graphing data to simulate a real FRQ that students would see on the AP exam.
By the end of this lesson, they will be able to use error bars on a graph to determine if data is or is not statistically significant.
If this works well for you, check out my chi square lab, water potential lesson, and other resources at my teacher page.


