Statistics Project: Data Analysis & Graphing- real life, no prep
- PDF
What educators are saying
Also included in
- This bundle includes all you need to teach the 6th grade CCSS for statistics & probability- print and go, NO PREP needed. It will walk you and your students through analyzing and creating bar graphs, dot plots, histograms, and box plots. Key terms are embedded naturally throughout the units forPrice $19.99Original Price $24.99Save $5.00
Description
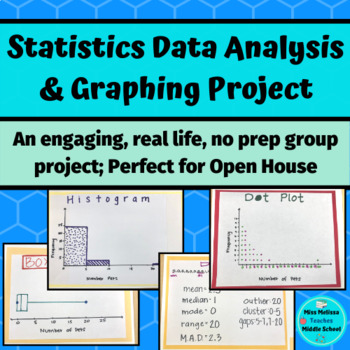
This statistics project is intended as a closure for your sixth grade statistics unit and aligns with ALL of the sixth grade statistics and probability common core state standards. In groups, students work together to choose a statistical question to ask the class. Once the class is surveyed, the group works together to create a frequency table, a dot plot, a histogram, and a box and whiskers plot. After creating their graphs, the groups analyze their data by looking at the mean, median, mode range, clusters, gaps, mean absolute deviation, and outliers. At the end of the project, groups present at least one graph and their discoveries to the class. I've used this project for seven years now and found it extremely successful and productive. For many students, this project serves as an "aha" moment for how to create statistical graphs and WHY we use them. Students love this project because they get to focus on a question that they came up with, so there's personal buy in on their part and they can relate their data to a topic they connect with. The project takes 6-7 days and the final products are perfect to show off at events like Open House.
What is included?
- Day-by-day teacher guide
- Brainstorming sheet for statistical questions
- Statistical data recording sheet
- Instructions/checklist for students
- Data analysis questions with example answer key
- Project presentation instructions
- Note-taking graphic organizer for presentations
- Grading rubric
- Example project photo


