Statistics Project Unit 3 Spreadsheets Mean Median Mode Std. Deviation (2 day)
- Zip
- Excel Spreadsheets
Description
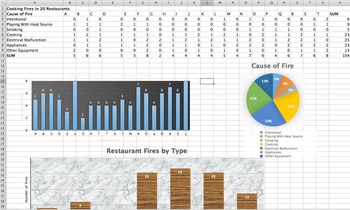
This is a 1-2 day project aimed at introducing a statistics class to Excel (or Numbers) who are familiar with Pie Charts, Bar Charts, Measures of Central Tendency, and Standard Deviation. The students will input data (included) into Excel (on fires in restaurants), form their own Bar Charts and Pie Charts, and be able to input formulas into the Excel to automatically calculate statistics. Students will be given the opportunity to explore different charts and design their charts to make them colorful/presentable.
*This is a bundle of PDF, Excel, Pages, and Word document files (so that you can edit yourself on any platform), with detailed instructions, project rubric, as well as solutions (Original document created with Pages)*
**This project is also included in my product "Statistics Unit Plan 3 - Central Tendency Variation" as well as "A Mountain of Statistics Curriculum" bundle for the entire class**
***Please read the "readme" text file and End User License Agreement contained in the Product. Thank you for respecting my work***


