Teaching Statistics with Spreadsheets (Self Grading)
- Zip
- Excel Spreadsheets
What educators are saying
Description
You can see a video that describes the basics of this course at the following link: https://www.youtube.com/watch?v=uZFpltXWyw8
This package is an entire statistics course designed for content to be delivered, taught, practiced, and assessed through spreadsheets. Students learn basic statistics and spreadsheet skills. This course is intended to allow for student collaboration and group work throughout the learning process. Each spreadsheet is automatically graded so students can see their progress as they complete the work. A learning management system like Google Classroom is ideal. Teachers can see their progress score and check the student graphs and conclusion descriptions to finalize their grade.
Our school calls this class "Truth and Data in the Modern World." A primary goal of the course is to help students process information and understand how experts create "facts." Students develop critical thinking skills along with knowledge of statistical ideas and procedures. Ideally students become aware of attempts to manipulate their opinions and votes (fake news).
Each of the units follows the following format:
A questionnaire is given to gather information to use in the lesson.
Students access the unit as an assignment (Sheets File) on Google Classroom. Make a copy for each student when you create the assignment.
The content in Lesson 1 for the unit will be taught. The data from the questionnaire will add relevance and make the instruction more interesting. Each lesson is automatically graded so students can see their progress as they complete the work. The teacher notes will provide videos of the content being taught. This can benefit the teacher and the students. Teachers also have access to a key for all lessons.
After the instruction and guided practice, the students will practice the skills in lesson 1.
This process of teacher and guided practice is repeated for lessons 2 and 3 of the unit.
A review assignment is available to give students another day of practice before the project.
Students form groups and access the Group Project as an assignment on Google Classroom. This project is the assessment for the unit. Students create questions around a central topic to investigate. Online research will also be performed about the topic. Groups will construct final conclusions about the truth for their topic and question set. The file automatically
Students research their question online and modify their question if appropriate. Ideally students learn to triangulate their sources (3 sources) that agree to show what is true. Each project is automatically graded so students can see their progress as they complete the work.
Upon submission of the assignments and projects, teachers can see their progress score, check the student graphs, and read their final conclusions to finalize their grade.
The following describes the twelve units in the course:
Unit 1: 1 sampling terms; Bias; bar graphs, pie charts, bad graphs
Unit 2: two way tables; marginals; percent
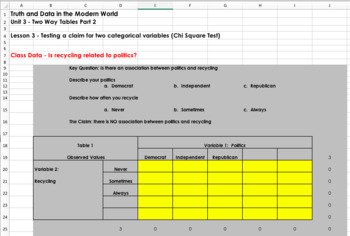
Unit 3: more two way tables; conditionals; chi square
Unit 4: dot plot, describe shape; stem-leaf plot; histograms
Unit 5: five number summary; box plot; outliers
Unit 6: mean; standard deviation; skew
Unit 7: percentiles; z-scores; completely randomized design, placebo/control; reaching causation and generalizability
Unit 8: standard normal curve; normal curve calculations; is the data normal?
Unit 9: confidence interval of mean; confidence interval for proportions
Unit 10: significance test for mean; significance test for proportions;
Unit 11: scatterplots; correlation & coefficient of determination; regression equations
Unit 12: confidence interval for the difference of 2 means; confidence interval for the difference of 2 proportions
The following resources are available for each unit:
Teaching Notes (includes the video links for the unit)
Student Questionnaire for the unit
Spreadsheet file for the lessons and review
Answer Key for the Lessons
Spreadsheet file for the project (Two type: group and individual)
Answer Keys for both types of projects
Other overall resources:
Final exam (simplified content). This is optional and also includes a key and a review.
My ideas for grouping for the projects and how to deal with non-workers.
The units are available for download in Excel Format. These can be used on Google Classroom, another learning management system, or added to a teacher webpage.
Length – You can pick and choose from the topics to create a semester course (math elective) or spread out all the content for an entire year.
My idea for what might soon be added: a series of lessons dedicated to recognizing fake news...


