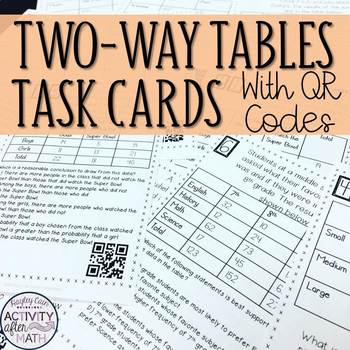
Two-Way Tables (Interpreting Data) Task Cards with QR Codes
- PDF
What educators are saying
Also included in
- This is a bundle of all 16 current 8th Grade Task Cards that are currently in my store. You are receiving over a 20% savings from purchasing this bundled product! Each Task Card file contains TWO sets of task cards-One with QR codes and one without QR Codes, student recording sheet, and answer key.TPrice $35.00Original Price $50.50Save $15.50
Description
Get your students involved with practicing Interpreting Data with Two-Way Tables! This is a great activity that can be used in Math Centers, as individual work, or as a group activity! This gets students moving and also integrates the use of technology into the classroom by scanning QR Codes to check your answer to get immediate feedback!
Click here to SAVE and get this as a Task Cards BUNDLE
This resource includes:
- Teacher Instructions
- Student Instructions
- 20 Task cards with QR codes
- 20 Task cards without QR codes
- Blank Answer Document for students
- Answer Key for easy grading
Options for using this resource:
You can print the ones with QR codes for students to check their own answers and receive immediate feedback. You could print the Task Cards without the QR codes for students to use without technology or to see what they know without checking their answers!
This can be used in Math Centers, as individual work, or as a group activity. This gets students moving and also integrates the use of technology into the classroom by scanning QR Codes to check your answer to get immediate feedback.
-----------------Want this as a GOOGLE Slide Digital version? Click here!!------------------
You might also be interested in these other resources:
Scatter Plot and Line of Best Fit Task Cards with QR Codes
Systems Of Equations Tasks Cards with QR Codes
Functions Task Cards with QR Codes
Common Core Aligned
CCSS.MATH.CONTENT.8.SP.A.4
Understand that patterns of association can also be seen in bivariate categorical data by displaying frequencies and relative frequencies in a two-way table. Construct and interpret a two-way table summarizing data on two categorical variables collected from the same subjects. Use relative frequencies calculated for rows or columns to describe possible association between the two variables.
CCSS.MATH.CONTENT.HSS.ID.B.5
Summarize categorical data for two categories in two-way frequency tables. Interpret relative frequencies in the context of the data (including joint, marginal, and conditional relative frequencies). Recognize possible associations and trends in the data.
Don't forget that leaving feedback earns you points toward FREE TPT purchases
© Hayley Cain (Activity After Math) Please note - this resource is for use by one teacher only. Additional teachers must purchase their own license. If you are interested in purchasing several licenses, please contact me. Thank you for your feedback and Happy Teaching!
activityaftermath@gmail.com
★Let's be Social


