98 results
Free Common Core 8.SP.A.2 resources
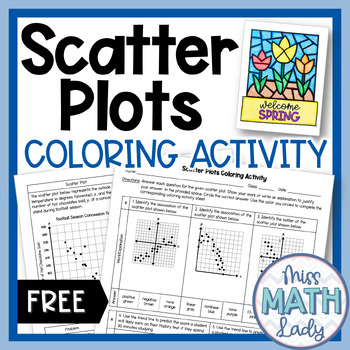
FREE Scatter Plots 8th Grade Math SPRING Coloring Activity
Are you looking for an engaging activity that provides students with the opportunity to practice their understanding of scatter plots? If your students are ready to review bivariate data such as patterns of association, outliers, making predictions, and creating trend lines, this printable Spring coloring activity is just what you need!This activity includes 10 multiple choice problems per worksheet. Each problem has three answer choices to choose from. This worksheet assesses the following conc
Subjects:
Grades:
8th
Types:
Also included in: 8th Grade Math Spring and Summer Color by Number Activity Bundle
U.S. President -- Data Analysis & Statistics Inquiry - 21st Century Math Project
Engage students in data analysis through use of Presidential data in this 21st Century Math Project. Students will create box and whisker, stem and leaf, histograms and scatterplot through their investigations. In the end, students will take on the inquiry question: "Do US Presidents with the most children live longer after they have been inaugurated?" ***THIS PRODUCT HAS BEEN UPDATED WITH A GOOGLE SLIDES INTERACTIVE VERSION INCLUDED. REDOWNLOAD IF YOU HAVE IT ALREADY***-- In "He Entered a Youn
Subjects:
Grades:
6th - 12th
Types:
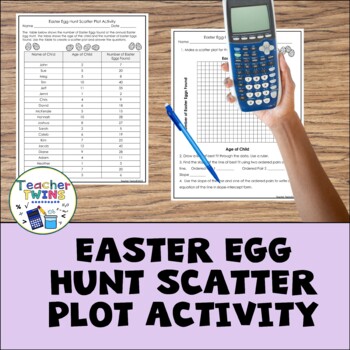
Easter Egg Hunt Scatter Plot Activity
Need a fun activity for Easter? This scatter plot activity has students creating a scatter plot using data from an Easter Egg Hunt.Students will create a scatter plot, draw a line of best fit, and write an equation for the line of best fit.Included in this productScatter Plot ActivityAnswer KeyLooking for additional Scatter Plot Activities?Try these activities.Scatter Plots and Two-Way Tables UnitScatter Plots and Line of Best Fit StationsDigital Self-Grading Reading Scatter PlotsFor more Digita
Grades:
8th - 10th
Types:
CCSS:
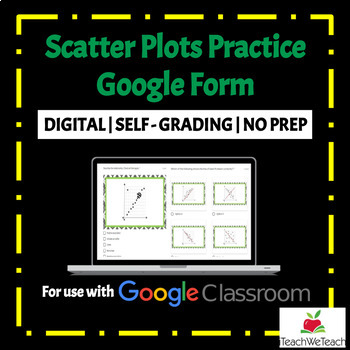
Scatter Plots | Google Forms Activity
★ DIGITAL Math Resource★ Are you looking for quality, standards aligned math resources to use with Google Classroom™? This resource is a fun and engaging way for students for practice solving problems involving scatter plots. This product includes a Google Form with 20 questions about scatter plots. Problems cover correlation type, the line of best fit and predicting scatter plot values. Possible Uses:• Practice• Homework • Assessment• ReteachCheck out my other products HERE.Please review my ter
Subjects:
Grades:
7th - 12th
Types:
FREE EDUCATIONAL WEBSITES LIST 4 ALL GRADES K-12 AND SUBJECTS + TEACHER RESOURCE
Sometimes, you just need a list of websites for everyone. Here it is. FREE EDUCATIONAL WEBSITES Put together by Teach Me, Maria!It takes time to gather this information, figure out the appropriate grade levels, and format, maintain, and update this page. All I ask is for an honest review if this list helps you.
Subjects:
Grades:
PreK - 12th, Staff
Types:
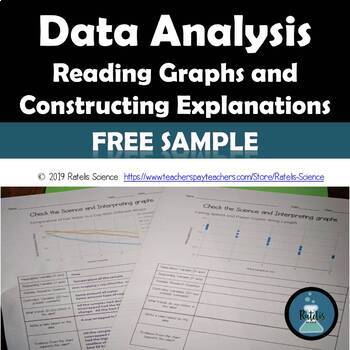
Data Analysis Reading Graphs Sample
Product DescriptionThis is a sample of the data analysis organizer I use for helping students analyze data and use that data to create a scientific explanation (claim, evidence and reasoning). I use this organizer with data from labs done by my classes. I collect the data in a spreadsheet and use it to make a larger data set for students to analyze as a weekly graphing practice. This also gives us the opportunity to talk about experimental design, trends in data and to work with larger data se
Subjects:
Grades:
6th - 8th
NGSS:
MS-PS2-3
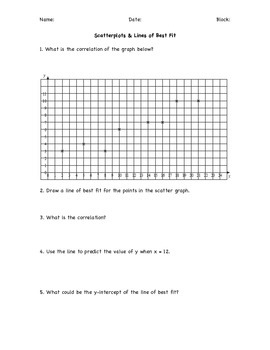
Scatterplots and Line of Best Fit Practice
8.SP.A.1 and 8.SP.A.2: Students create and use scatterplots to identify correlations and create lines of best fit for those scatterplots. Students use the lines of best to predict other values.
Subjects:
Grades:
8th
Types:
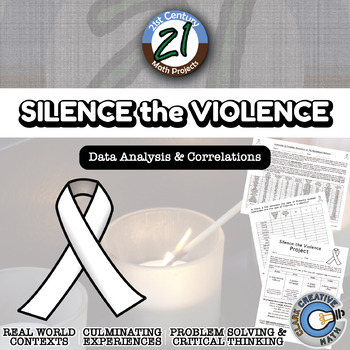
Silence the Violence -- International Data Analysis - 21st Century Math Project
Silence the Violence intends to take a closer look at gun violence throughout the world. Is there a correlation between gun ownership and gun violence? While this is on the news, and people argue back and forth, unfortunately there are not a lot of statistics cited.I built this project through the use of correlations of authentic international data. I have included content for either middle school (plotting and calculating) or high school (calculating correlation with summations). The results ar
Subjects:
Grades:
6th - 12th
Types:
CCSS:
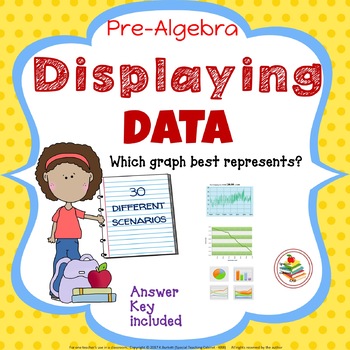
Displaying Data Math Graph Matching Activity
Displaying Data Math Graph Matching Cooperative Activity
Match 30 different scenarios to 6 types of graphs: circle graph, line graph, line plot, histogram, bar graph, scatter plot. Answer Key included!
Other teaching options:
Cooperative learning activity to reinforce previous learned taught material. Give students sets of task cards to answer with their group.
Small groups, present few scenarios at a time. When groups are finished, discuss given scenarios as a whole group before moving onto
Subjects:
Grades:
6th - 8th
Types:
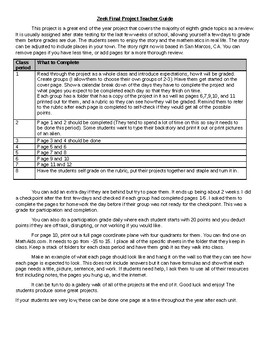
Zeek the Alien Friend- 8th Grade Math End of the Year Project
This project was created to be an end of the year project that covers the majority of eighth grade topics as a review. It is usually assigned after state testing for the last few weeks of school, allowing yourself a few days to grade them before grades are due. The students seem to enjoy the story of meeting an alien and teaching him math as they experience things together in real life. The story can be adjusted to include places in your town. The story right now is based in San Marcos, CA. You
Subjects:
Grades:
8th - 9th
Types:
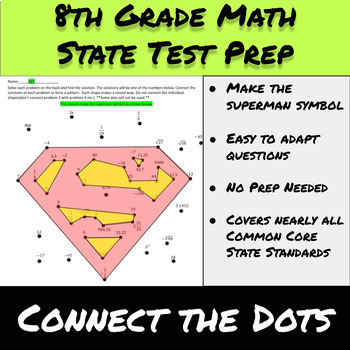
8th Grade Math State Test Prep-Connect the Dots-Superman
This connect the dots activity will keep your kids guessing what the shape is until the very end. Mine love to make while guesses while working. The final picture will be something your students should recognize as the Superman logo.Questions too Hard or too Easy? This is provided as a Google Doc and it set up so all questions are easy to adapt for the needs of your students.Students will practice nearly all of the Common Core State Standards for 8th grade math in this activity. Most questions
Grades:
8th - 9th
Types:
Also included in: 8th Grade Math-Algebra and Pre-Algebra Whole Course Growing Bundle
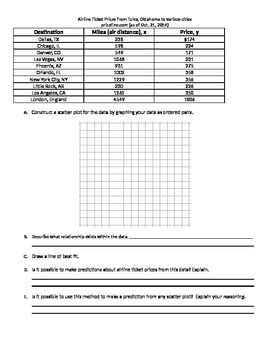
Construct Scatterplots Using Airline Ticket Prices
Students will create an original scatterplot on airline prices using miles and cost as their variables. Then they describe the relationship (positive) they see in the data, create a line of fit, and make predictions based on the data. You could easily adjust this to be more of a technology project by deleting out the amounts and requiring students to go online and find their own values.
Grades:
7th - 9th
Types:
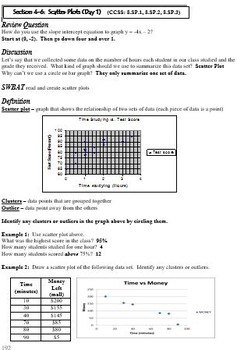
Statistics and Probability: Scatter Plots and Best Fit Lines
This is a 9 day lesson plan (powerpoint and hard copy) covering the topics of scatter plots and best fit lines. Each lesson includes a review question, discussion, problems for teacher to model, and problems for the students to try. The lesson plan includes days of instruction, days of practice, assignments, activities, and a project.
Subjects:
Grades:
7th - 9th

Parachute Lab - Scientific Method, Experimental Design, and Engineering
PARACHUTE ENGINEERS!! UPDATED AND READY FOR NGSSIn this lesson, your students will become parachute engineers. By using the principals of the scientific method and scientific inquiry they will design a parachute and make a modification to test a hypothesis. Lab is written for grades 7-9, but can be applied and/or modified for grade 6-12.You will begin with a DO NOW that typically elicits humorous answers from your students, and feed right into the creative, hands-on fun and learning. This le
Grades:
6th - 10th
Types:
NGSS:
MS-ETS1-2
, MS-ETS1-4
, MS-ETS1-1
, MS-ETS1-3
Spiral Review Math Warm-Ups - Bell Ringers - Mixed Topics - Level 1 - FREE!!
Sample our multiple choice math warm-ups with detailed easy-to-understand solutions designed to build those basic math skills AND prepare students for standardized testing! Review and reinforce foundational math concepts! Our free sample includes 5 pages of problems with their corresponding solutions (15 problems total with solutions). These exercises were developed by two certified high school math teachers based on their students’ needs. This sample and our line of Level 1 Spiral Review Warm
Subjects:
Grades:
7th - 9th
Types:
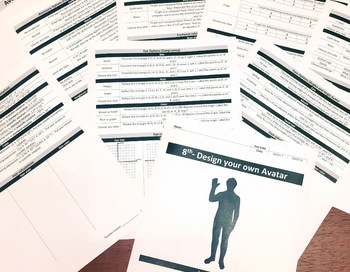
Design your own Avatar Activity- 8th Grade- Fun End of Year Review
A fun way to get students to review some of the material from the year. They choose the characteristic they want and solve the problem that goes with it. They create and color the avatar as they go. They can show and compare at the end.Questions can be customized. The template is made and can be used for any activity throughout the unit.Answer key included.Please leave feedback!
Subjects:
Grades:
8th
Types:
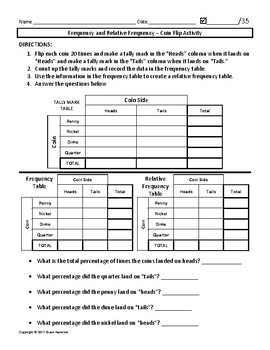
Frequency and Relative Frequency Coin Flip Activity
This is a great class activity to reinforce frequency and relative frequency tables.
*I copy this assignment front/back.
1. Divide the class into pairs. *I prefer pairs in this activity because one person flips and the other writes down the data. This way, no one is just sitting there :).
2. Pass out the worksheet and a bag with a penny, nickle, dime, and a quarter. I remind students that I am going to be wanting that money back..haha.
3. I go through the instructions and explain that they wi
Subjects:
Grades:
8th - 9th
Types:
Bivariate Data Project: Height vs Shoe Size
A google slides activity that can aligns with ACOS and CCSS standards.This is a discovery based learning activity. Well suited for any middle school math classroom. Students will collect bivariate data from their classmates using a google form & google slides. They will then graph the data using a desmos graph and discuss the relationships they discover. CCSS.MATH.CONTENT.8.SP.A.1Construct and interpret scatter plots for bivariate measurement data to investigate patterns of association betwe
Subjects:
Grades:
7th - 8th
Types:
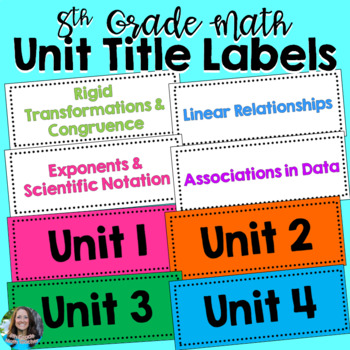
FREE 8th Grade Math Units Labels for Word Wall Back to School
Print these labels to display your 8th Grade Math Vocabulary Posters, anchor charts, or anything you need labeled. Print in black and white on colored paper or some options are available to print in color. Each label is half of a sheet of paper. All labels are listed below.Vocabulary Posters:8th Grade Math Full Year Posters SetPythagorean TheoremTransformationsAngle RelationshipsExponent RulesLinear RelationshipsFunctionsVolume of Cylinders, Cones, & SpheresScientific NotationRational and Ir
Subjects:
Grades:
8th
Also included in: 8th Grade Math Vocabulary Posters for Word Wall - Full Year
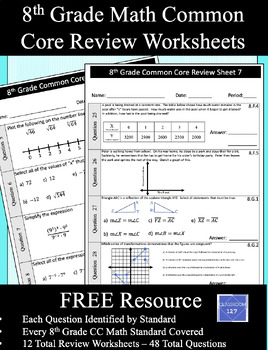
8th Grade Math Common Core Review Worksheets
This resource is a cumulative 8th grade math review of the Common Core State Standards. 12 worksheets make up this resource each containing 4 different questions. Every question is aligned to a standard.This resource is great for homework assignments or for in-class work prior to high stakes testing.________________________________________________________________________________________________Need more materials to help your students master the 8th Grade Common Core Math Standards? Be sure to c
Subjects:
Grades:
8th
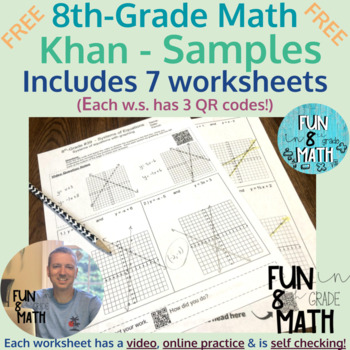
8th Grade Math - Khan Resource SAMPLES
This product contains 7 worksheets from my line of 8th-grade math Khan resources. The full resource contains 74 worksheets! Each worksheet contains practice problems and three QR codes. All of the QR codes in this document can either be scanned with a smart device or clicked on if given paper/pencil. I also included an answer key for each worksheet. The student starts by scanning the top QR code which takes them to a Khan Academy video. The student watches the video and takes notes in the first
Subjects:
Grades:
8th - 9th
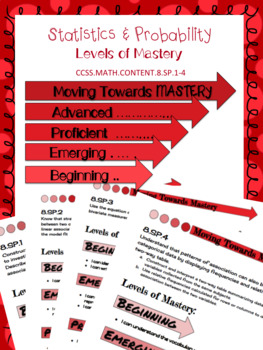
8.SP Scatter Plot & Two-Way Table Levels of Mastery
This product was created to use as an introduction to teaching the eighth grade statistics and probability standards. It allows students to evaluate themselves throughout the process of teaching the standards. It can be printed and provided to each student or printed as posters to be hung in the classroom for easy reference.
Levels of mastery are:
→ Beginning
→ Emerging
→ Proficient
→ Advanced
Levels of Mastery Posters:
★ 8.SP.1 Constructing & Interpreting Scatter Plots
★ 8.SP.2 Line of
Subjects:
Grades:
8th, Higher Education
Types:
CCSS:
Also included in: 8th Grade Math Common Core Growing Bundle
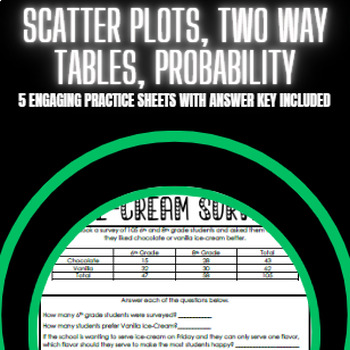
Scatter Plots, Two Way Tables, and Probability Practice
Five worksheets for students to practice creating and interpreting scatter plots, creating and reading two-way tables, calculating relative frequency, and calculating probability.
Grades:
5th - 10th
Types:
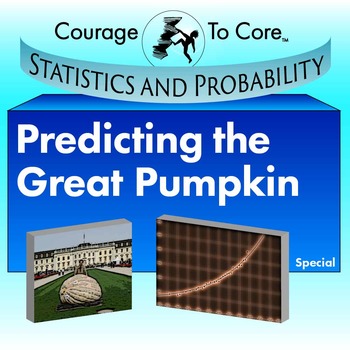
Predicting the Great Pumpkin: 8.SP.A.1...
Students will speculate on the world records for weights of pumpkins. They will graph the data for the records and find the line of best fit. They will either use a graphing calculator or given graphs and functions to explore quadratic and exponential regressions. They will make a short-term prediction about the world record in 2015. This mission is aligned with Common Core Standards: 8.SP.A.1, 8.SP.A.2, 8.SP.A.3.
The fun stuff:
2323 pounds. That’s the weight of a world record for the heaviest
Subjects:
Grades:
7th - 11th
Showing 1-24 of 98 results

