32 results
Common Core 8.SP.A.2 resources for Easel
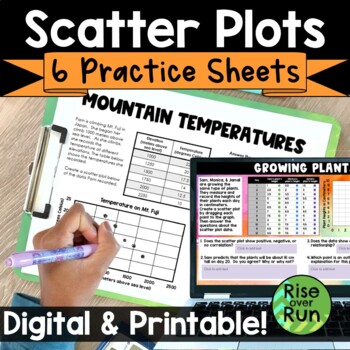
Scatter Plots & Line of Best Fit Practice Worksheets
Practice using scatterplots with these six activities. They can be used as bell ringers, exit tickets, homework, or just general practice. Students graph points, interpret data, and look for types of correlation with these practice sheets. All practice sheets are included as printable PDFs and interactive Google Slides. 6 scatter plot activities are included:Test Grades Scatter Plot PracticeMountain Temperatures Scatter Plot PracticeGrowing Plants Scatter Plot PracticeHair Length Data Collectio
Grades:
8th - 9th
Types:
CCSS:
Also included in: 8th Grade Math Activities & Lessons Bundle for the Whole Year
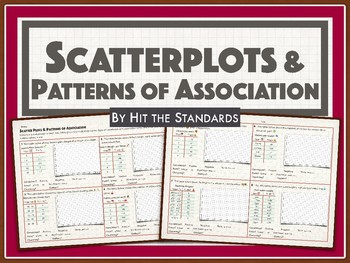
Scatterplots & Patterns of Association
Students must construct and interpret scatter plots from 8 different data tables and investigate patterns of association such as clustering, outliers, positive or negative correlation, linear or nonlinear association. Data tables are based on real world problems, students must plot the data points to construct the scatter plots. Common Core 8SP.1 & 8SP.2TEKS 8.11A Save $$$ and time by downloading the complete 8th Grade Math Unit10 Making Connections (End of Year Activities) (STAAR review) 4
Subjects:
Grades:
6th - 9th
Types:
CCSS:
Linear Functions Unit (Includes Linear Regressions) - Algebra 1 Curriculum
20 DAYS of GRAPHING and WRITING Linear Functions AND Scatter Plots and Trend Lines! With 20 days of Linear Functions and Equations, this large unit covers ALL aspects of the most heavily tested Algebra 1 function.The Linear Functions Unit has been updated with a fresh look, new answer keys, a variety of options and now includes a Google Forms and TPT Easel version of the unit test!THE LINEAR FUNCTIONS UNIT INCLUDES:15 lessons and assignmentsonline tutorial videos 2 quizzes (A & B versions e
Subjects:
Grades:
8th - 10th
Types:
Also included in: Algebra 1 Curriculum Fall Semester Bundle
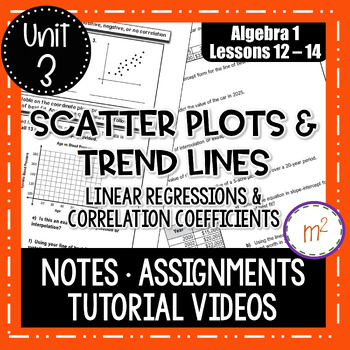
Scatter Plots and Trend Lines (Linear Regressions) - Algebra 1
Algebra 1 Notes and Assignments over Scatter Plots and Trend Lines. TUTORIAL VIDEOS included (no prep to you!) and can be found on my YouTube Channel: mandy’s math world - the videos are on the Linear Functions Unit Playlist! This product includes THREE days of lessons and assignments. Day 1 introduces scatter plots, positive/negative/no correlations, and making predictions by interpolating and extrapolating data. Students will identify general correlations, draw trend lines and make predictio
Subjects:
Grades:
8th - 11th
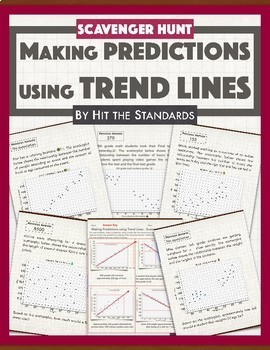
Predictions from Scatterplots using Trend Lines (best fit) -SCAVENGER HUNT
This Making Predictions using Trend Lines Scavenger Hunt is an excellent activity for students to practice working with scatter plots, lines of best fit, graphing, and the best part is that they get to move around the classroom looking for the next problem to solve! Directions: Print the 10 problems and scatter them around the room .Give one student worksheet to each student, place them in groups of 2 or 3 and assign a problem to each group. Students must make predictions for each problem using
Subjects:
Grades:
8th - 9th
Types:
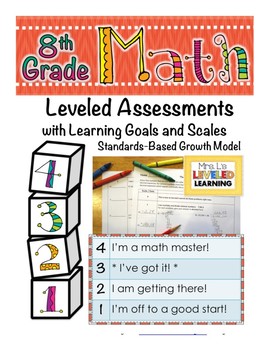
8th Grade Math Leveled Assessment for Marzano Proficiency Scale - EDITABLE
Learning Goals and Scales are the ultimate Standards Based Grading tool! They don't just motivate a Growth Mindset, they define how students can demonstrate mastery. Every learning standard is broken down into 4 levels of Differentiation. Also known as a scaffold for learning. These Assessments lead students up a progressive learning path that mirrors the way they develop concepts. Aligned to Bloom’s or Marzano’s Taxonomy of cognitive skills. From easiest-hardest: (Recall/Retrieval, Comprehensio
Subjects:
Grades:
8th
Types:
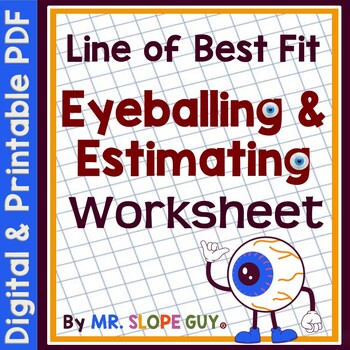
Line of Best Fit Practice Worksheet
Hello Math Teachers! Are you looking for a fun and engaging way for your students to practice their scatterplot skills? Check out this worksheet that focuses on eyeballing the line of best fit and estimating the correct equation that corresponds with it.With this two-sided worksheet, students will have the opportunity to practice using scatterplots and make the connection to the fit of a linear function. The scaffolding includes matching equations to the line of best fit (regression line), which
Subjects:
Grades:
8th
Types:
CCSS:
Also included in: Scatterplots Two Way Tables and Residual Plots Worksheets Bundle
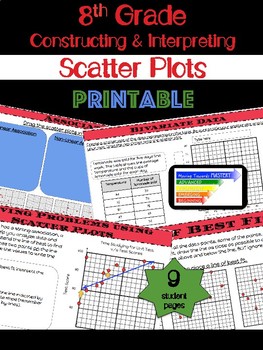
8th Grade Math Constructing & Interpreting Scatter Plots
Extensive printable lessons for constructing and interpreting scatter plots.The lessons are scaffolded to build understanding. Students will progress from identification of terms to making predictions involving bivariate data. The guided lessons will begin with identification, move towards assisted analysis, and conclude with independent practice.Lessons include...♦ Definitions and Visual Representations♦ Identification and Use of Terms → Bivariate Data → Scatter Plot → Linear, Nonli
Subjects:
Grades:
8th - 10th
Types:
CCSS:
Also included in: 8th Grade Math Common Core Growing Bundle
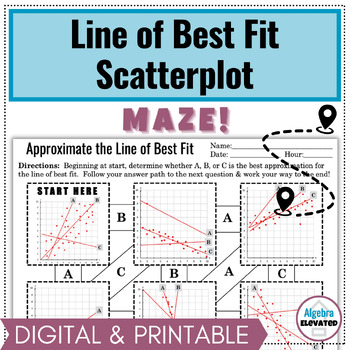
Scatterplot Line of Best Fit Activity Maze (Digital and Printable)
Do your students need a scatterplot line of best fit maze that is printable and digital? For this maze students will practice accurately identifying the line of best fit for scatterplots. Students begin at the start box and work their way through the maze to reach the finish. Includes digital and printable versions of this 11 question maze with a 10 question path – answer key for easy grading also included. ✏️ This Resource Contains ✏️Printable MazePrintable Student Work HandoutAnswer KeyDigital
Grades:
8th
Types:
CCSS:
Also included in: Algebra Maze Digital and Printable Activity Bundle
Grade 8 Math - SBA Test Prep and Practice: 128 Parallel Spiral Review Items
This document is both a year-long teacher-planning tool AND a preparation tool for the Grade 8 SBA Adjusted-Form Summative in math. Included in the document: the Blueprints for the Adjusted-Form Summative, brief overviews of the Targets used by the test writers to guide item writing for the yearly assessment; and spiral-review problems that are parallel (but not identical) to items from the Practice Tests that have been on the Portal. In short, everything in one handy place to guide instructio
Subjects:
Grades:
8th
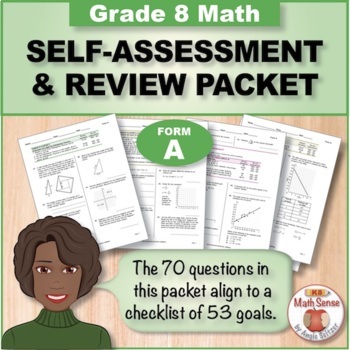
Grade 8 Form A Math Self-Assessment Packet - 70 Questions { Print & Digital }
This packet provides student-friendly math goals with related review questions for eighth grade. This PDF has been prepped for Easel and already includes answer boxes. Assign directly to students via TpT and Google Classroom. Three parallel versions, Forms B, C, and D are available so you can check progress four times during the year. Packets are available for grades 3-8!FEATURES OF REVIEW PACKETS (Forms A, B, C, D)• Self-assessment checklist of goals for each Common Core cluster• 70 review ques
Subjects:
Grades:
8th
GED Math - Intermediate Problems - 8 Weeks
Your students already know how to work with fractions, decimals, percents, and a calculator. Now get them to the next level. Give them these problem sets to help them pass the GED or HiSET Math tests in 6 to 9 weeks.Use These Problem Sets To:Have students work through up to 9 weeks of problem sets in class, for 3 to 6 hours per week.Teach a variety math topics that are key for college and career readiness, and for passing the GED/HiSET math tests, including: word problems, expressions, equations
Subjects:
Grades:
6th - 12th, Higher Education, Adult Education, Staff
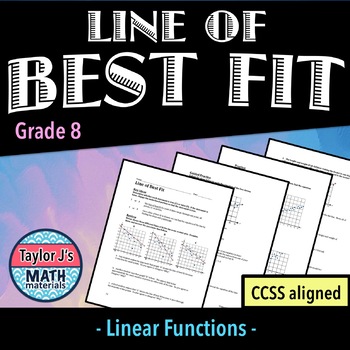
Line of Best Fit Worksheet
Students draw the line of best fit based on scatter plots and answer contextual questions.What is covered:- Students review vocabulary: scatter plot, correlation- Students are guided to write the equation of a line of best fit- Students draw the line of best fit and write the equation of the line- Students answer questions based on a real life scatter plot and line of fit4 Student Pages; 4 Teacher PagesPossible uses:bellringer or warm up, exit ticket, homework, informal assessment or quiz, test
Subjects:
Grades:
7th - 9th
Types:
Also included in: Bivariate Data Worksheet Bundle
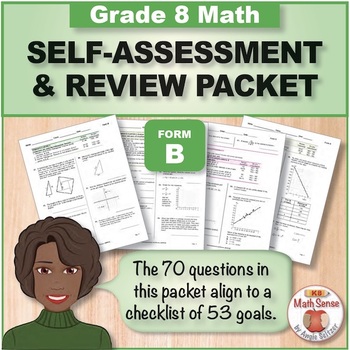
Grade 8 Form B Math Self-Assessment Packet - 70 Questions { Print & Digital }
This packet provides student-friendly goals with related review questions for eighth grade math. This PDF has been prepped as a TpT Digital Activity and already includes answer boxes. Assign them directly to students via TpT and Google Classroom. Parallel versions, Forms A, C, and D enable you to check progress four times during the year. Please see the Preview, which downloads quickly. FEATURES OF REVIEW PACKETS (Forms A, B, C, D)• Self-assessment checklist of goals for each Common Core cluste
Subjects:
Grades:
8th - 10th
Algebra 1 Midterm - Algebra 1 Paper and Digital Assessment
This is the ultimate Algebra 1 Midterm for your students. This Algebra 1 Midterm comes in both a digital format and a paper format. There are 66 questions that cover key Algebra 1 concepts from the first semester. This resource was created with differentiation in mind, so be aware that if you use the paper version you may need to grade on a curve, as it is mostly free response and I purposely threw in some trick questions to ensure complete mastery of the first semester of Algebra 1. The digital
Subjects:
Grades:
7th - 10th
Types:
Also included in: Algebra 1 Christmas Activity BUNDLE
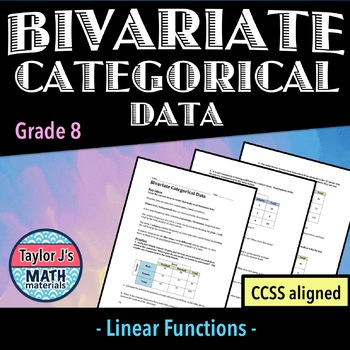
Bivariate Categorical Data Worksheet
Students calculate cell, row, and column relative frequencies based on two-way tables and answer contextual questions.What is covered:- Students review vocabulary: bivariate data, categorical bivariate data, relative frequency, row/column relative frequency- Students calculate cell, row, and column relative frequencies based on two-way tables and answer contextual questions3 Student Pages; 3 Teacher PagesPossible uses:bellringer or warm up, exit ticket, homework, informal assessment or quiz, tes
Subjects:
Grades:
7th - 9th
Types:
Also included in: Bivariate Data Worksheet Bundle
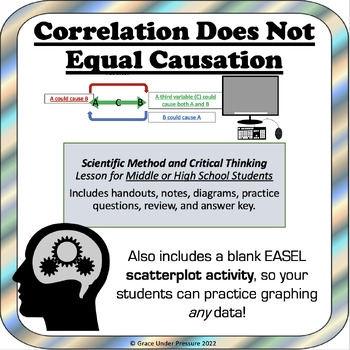
Correlation Does Not Equal Causation: Scientific Method & Critical Thinking
Scientific Method and Critical Thinking Lesson for Middle or High School Students: This printable booklet teaches students about correlation, scatterplots, correlation coefficients, third variables, true experiments, independent and dependent variables, random assignment and more in an easy-to-understand and engaging manner.12 different correlation examples are included. The package includes handouts, notes, diagrams, practice questions, a review, and an answer key.I have also included my blank
Subjects:
Grades:
8th - 12th
Types:
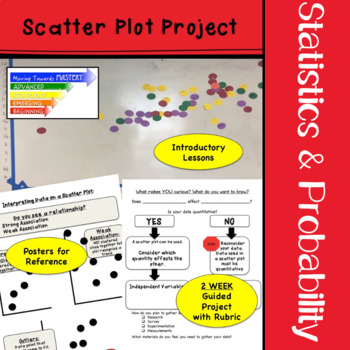
Scatter Plot Project End of Year Math Activity with Real World Data
TWO Week guided project for constructing and interpreting scatter plots. This engaging scatter plot project is individualized to allow students to research areas of interest. This project is great for a math end of year activity but it can also be used year round! Students will gather data on their topic of choice and use the project plan to organize their data into a scatter plot. Students will then analyze the results of the data collected.Six posters to guide students as they work independent
Subjects:
Grades:
8th - 10th, Higher Education
Types:
CCSS:
Also included in: Middle School Math Projects for End of the Year Activities
Introduction to Scatter Plots Worksheet
Students construct and describe scatter plots from a set of data.What is covered:- Students review vocabulary: scatter plot, correlation- Students identify scatter plots that have a correlation- Students construct and describe scatter plots from a set of data3 Student Pages; 3 Teacher PagesPossible uses:bellringer or warm up, exit ticket, homework, informal assessment or quiz, test prep*************************************************************************************************************Yo
Subjects:
Grades:
7th - 9th
Types:
Also included in: Bivariate Data Worksheet Bundle
Grade 8 Math Smarter Balanced Math Summative Prep. - Higher Thinking/Application
This guide is designed for dual purposes: 1) help teachers and students prepare for the Grade 8 SBA Adjusted-Form Math Summative Assessment, and 2) give students practice interacting with problem-solving questions involving application of grade-level math skills.81 questions taken from the 2015 and 2017 Practice Tests/Performance Tasks/Training Tests are included.Easel-formatted items document included.Aligned to CA Math Standards and the Common Core Math Standards.
Subjects:
Grades:
8th
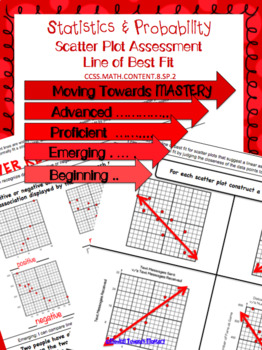
8.SP.2 Scatter Plots: Line of Best Fit Assessment
Assessment for Scatter Plots: Line of Best Fit that measures understanding at various levels of mastery to identify at what level students have progressed. Levels of mastery are:→ Beginning → Emerging→ Proficient→ AdvancedEASY printing with answer key--------------------------------------------------------------------------------------------------------------------------------------------------------------These printable worksheets can also be used as digital resources through the TpT Digital Ac
Subjects:
Grades:
8th - 10th
Types:
CCSS:
Also included in: 8th Grade Common Core Statistics & Probability Assessments
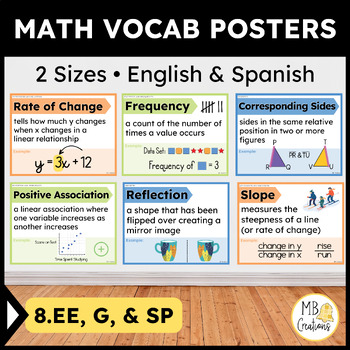
8th Grade iReady Math Banners Eng/Spanish Word Wall 8.EE/SP/G Vocabulary - Vol 2
Create a Math Word Wall and teach math vocabulary terms with simple definitions, examples, and visuals. Hang this English or Spanish word wall in your 8th-grade classroom. Present every math vocabulary term in the included PowerPoint slideshow. If you use iReady Classroom Math, print the color-coded banners that align with the 2020 curriculum. Print math posters in two sizes and clip together to form English or Spanish vocabulary cards!Check out the Contents of these Math Vocabulary Word Wall Po
Subjects:
Grades:
8th
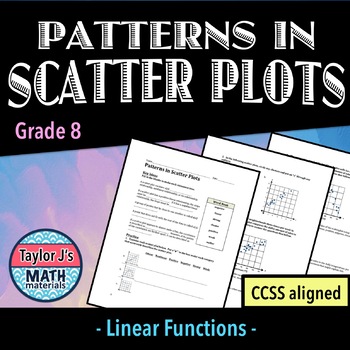
Patterns in Scatter Plots Worksheet
Students describe scatter plots using terms such as positive/negative, strong/weak, linear/nonlinear while interpreting clusters and outliers.What is covered:- Students review vocabulary in terms of a scatter plot characteristics: positive/negative, strong/weak, linear/nonlinear, cluster, outlier - Students identify such characteristics listed above- Students answer questions on scatter plots based on real life situations3 Student Pages; 3 Teacher PagesPossible uses:bellringer or warm up, exit t
Subjects:
Grades:
7th - 9th
Types:
Also included in: Bivariate Data Worksheet Bundle
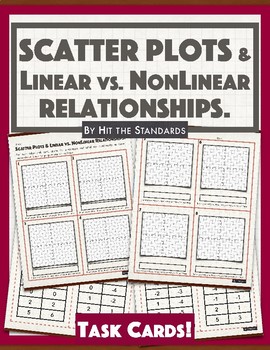
Scatter Plots: Comparing Linear vs. NonLinear Relationships Task Cards
In this Scatter plots & Linear vs. NonLinear Relationships, students will use data tables given on task cards to graph scatter plots and label each relationship as linear proportional, linear not proportional or not linear. There are 8 task cards with problems in total. I prefer to do this activity ion groups of 3 or 4, place the task cards in the center of the table and ask them to get one (order doesn’t matter),solve it, put the card back, get another one and repeat until all 8 problems ar
Subjects:
Grades:
7th - 9th
Types:
Showing 1-24 of 32 results

