10 results
General science Common Core 8.SP.A.2 resources
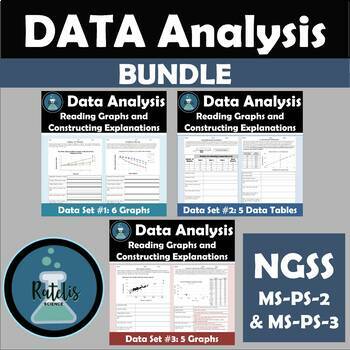
Analyzing and Interpreting Data and CER Worksheet Bundle NGSS Science Practices
Set of 17 worksheets with graphic organizer for helping students analyze data and use it to create a scientific explanation using NGSS Physical Science content with data sets on topics including motion, magnetism, sound, gravity, forces, and thermal energy. Supports lessons for NGSS Science and Engineering Practices of Analyzing and Interpreting Data, and Constructing Explanations.In the NGSS it is important that students work with larger sets of data and that they understand how to deal with th
Subjects:
Grades:
6th - 8th
Types:
NGSS:
MS-PS3-4
, MS-PS2-4
, MS-PS2-3
, MS-PS2-2
, MS-PS3-3
...
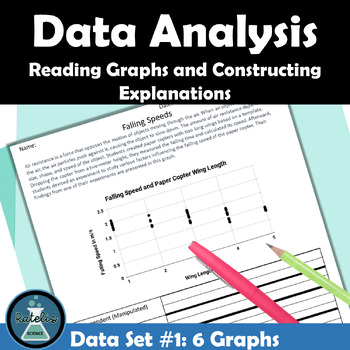
Analyzing and Interpreting Data Set #1 NGSS Reading Graphs and CER
In the NGSS it is important that students work with larger sets of data and that they understand how to deal with the natural "messy" data that most scientists have to work with. These 6 prompts use NGSS physical science content related to motion, magnetism, and thermal energy. This is a low-prep worksheet that works great as homework, an independent station, or a bellringer. I have also included a graphic organizer for helping students analyze data and use it to create a scientific explanati
Subjects:
Grades:
6th - 8th
NGSS:
MS-PS3-4
, MS-PS2-2
, MS-PS3-3
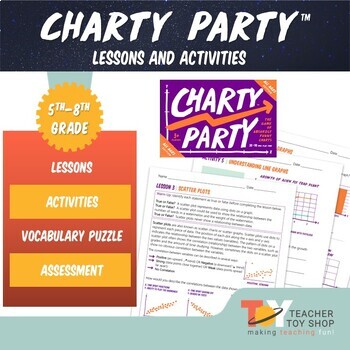
Graphing Lessons and Activities for Charty Party Game
Explore the engaging world of graphing with these Graphing Lessons and Activities for Charty Party Game, featuring nine interactive lessons that seamlessly blend learning with the excitement of a party game. Designed to teach line graphs, bar graphs, scatterplots, and more, these lessons are presented in kid-friendly language, making graphing concepts accessible and enjoyable for students. As they analyze graphs during the Charty Party™ game, students not only practice graphing but also delve in
Subjects:
Grades:
6th - 8th
Types:
NGSS:
MS-ESS3-2
, MS-ETS1-3
Also included in: Physical Science Activities and Lessons Bundle
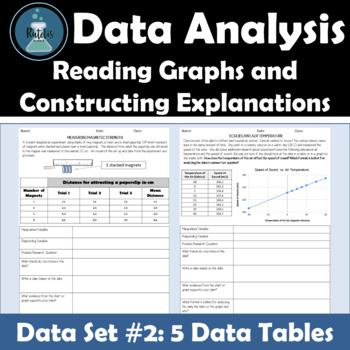
Analyzing and Interpreting Data Set #2 NGSS Reading Data Tables and CER
In the NGSS it is important that students work with larger sets of data and that they understand how to deal with the natural "messy" data that most scientists have to work with. These 5 prompts use NGSS physical science content related to magnetism, gravity, waves, and thermal energy. This is a low-prep worksheet that works great as homework, an independent station, or a bellringer. I have also included a graphic organizer for helping students analyze data and use it to create a scientific e
Subjects:
Grades:
6th - 8th
NGSS:
MS-PS2-4
, MS-PS2-3
, MS-PS4-1
, MS-PS3-3
, MS-PS2-5
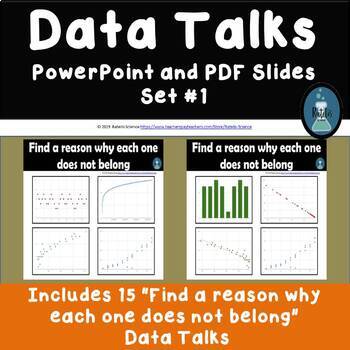
NGSS Analyzing and Interpreting Data Warm Ups Graphs with Odd One Out
A set of 15 warm ups designed for NGSS SEP: Analyzing and Interpreting Data Students are challenged to figure out which graph does not belong using observations of trends in bi-variate data, scatter plots and other graphs. This product was developed and tested for use with an 8th grade science class so the data skills are also aligned with the 8th grade CCSS for the following math Statistics and Probability Standards CCSS.MATH.CONTENT.8.SP.A.1 and CCSS.MATH.CONTENT.8.SP.A.2This is a technique
Subjects:
Grades:
6th - 8th
Types:
Also included in: Analyzing and Interpreting Data NGSS Data Talks BUNDLE #1
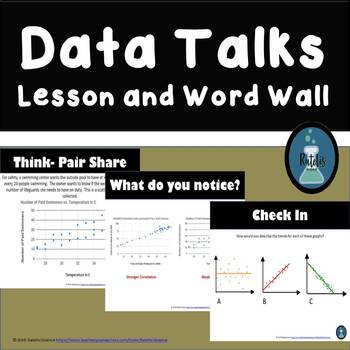
Analyzing and Interpreting Data NGSS Data Talks Lesson and Word Wall
Low Prep lesson and word wall for NGSS SEP Analyzing and Interpreting Data. I use it to help students connect background knowledge to new terms for data analysis in middle school science.This presentation is more student-driven in that we discuss what we are noticing and build class vocabulary around the data. We practice this with multiple graphs as the lesson builds and through warm-ups and discussing our results from labs done in class. So I let the students start out using what they already
Subjects:
Grades:
6th - 8th
Also included in: Analyzing and Interpreting Data NGSS Data Talks BUNDLE #1
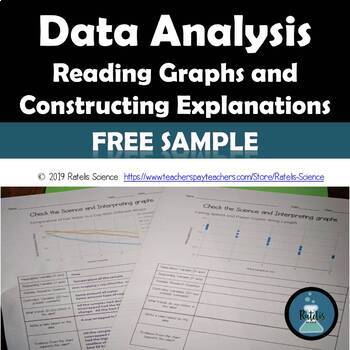
Data Analysis Reading Graphs Sample
Product DescriptionThis is a sample of the data analysis organizer I use for helping students analyze data and use that data to create a scientific explanation (claim, evidence and reasoning). I use this organizer with data from labs done by my classes. I collect the data in a spreadsheet and use it to make a larger data set for students to analyze as a weekly graphing practice. This also gives us the opportunity to talk about experimental design, trends in data and to work with larger data se
Subjects:
Grades:
6th - 8th
NGSS:
MS-PS2-3
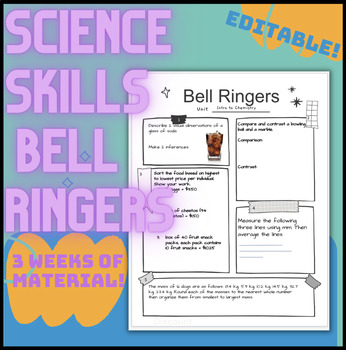
Science Skills Bell Ringers
3 weeks worth of bell ringers focused on basic science skills including determining variables, reading graphs and data tables, making observations and inferences, explaining your thinking, forming hypotheses, sorting information, averaging, measuring, compare and contrast, rounding data and creating a claim. Some questions are open ended and do not have a right/wrong answer, some do have correct answers. These bell ringers are best used with upper middle school through high school. Answer Key is
Subjects:
Grades:
7th - 12th
Types:
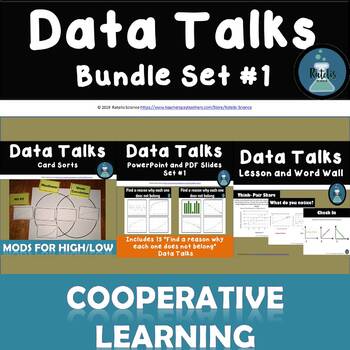
Analyzing and Interpreting Data NGSS Data Talks BUNDLE #1
Bundle of cooperative learning lessons on data analysis focusing on describing trends in data. Designed for NGSS SEP: Analyzing and Interpreting DataVocabulary ListCausationClusterCorrelationLinear RelationshipLine of Best FitNegative CorrelationNo CorrelationNon-linear RelationshipOutlierPositive CorrelationScatter PlotStrong CorrelationTrend LineWeak CorrelationI take pride in my materials and guarantee satisfaction. If you have any questions or comments, feel free to contact me.at science@rat
Subjects:
Grades:
6th - 8th
Types:
Analyzing and Interpreting Data NGSS Data Talk Warm Up Sample
A Data Talk is a short routine that provides students with meaningful ongoing practice in data analysis:•Keep Data Talks short, as they are not intended take up a lot of time•Spend only 5 to 10 minutes on Data Talks, DOING ONE SLIDE ONLY•Talks are most effective when done weekly to build up student thinking skills and data analysis vocabularyIn this set students are challenged to figure out which graph does not belong. Each graph could be the odd one out depending on which feature students choos
Subjects:
Grades:
6th - 8th
Types:
Also included in: Data Analysis NGSS Standards Custom Bundle #3
Showing 1-10 of 10 results

