7th Grade Math Anchor Charts | Interactive Notebooks, Posters, Print & Digital
- Zip
What educators are saying
Products in this Bundle (12)
showing 1-5 of 12 products
Bonus
Description
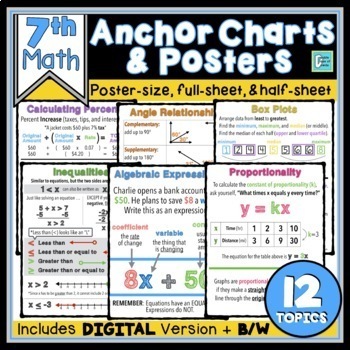
Looking for MATH ANCHOR CHARTS to help your students visualize the major topics in your 7th grade math classroom? Hang these on the wall as POSTERS and give students copies for their INTERACTIVE NOTEBOOKS. We keep anchor charts simple and neat so as not to overwhelm students and help keep them focused on essential information.
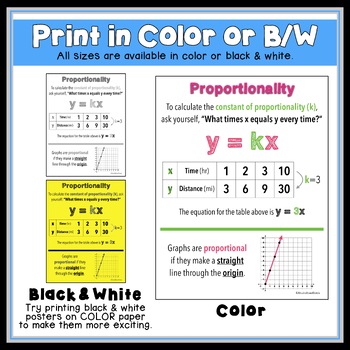
These are one-page anchor charts for 12 TOPICS that comes in THREE FORMATS including a single page, half sheets (great for interactive notebooks!), and a 2x2 POSTER. The poster will print on 4 sheets of paper which you will need to trim and tape to form one large poster.
⭐ As a SPECIAL BONUS when you buy the bundle you will receive a google slides digital copy of all 12 Anchor Charts to use and post in your online or hybrid classroom.
The Anchor Charts included are:
Rates Anchor Chart
Circles Anchor Chart
Proportionality Anchor Chart
Solving Equations Anchor Chart
Area Formulas Anchor Chart
Algebraic Expressions Anchor Chart
Box Plots Anchor Chart
Integer Operations Anchor Chart
Probability Anchor Chart
Calculating Percents Anchor Chart
Angles Anchor Chart
Inequalities Anchor Chart
What TEACHERS are saying about this product:
♥ "Extremely useful and easy to use as a resource in google classroom/distance learning as a resource/reference for students."
♥ "This was a great notes page for my students to refer back to while distance learning!"
♥ "I cannot wait to use these in my 7th grade math classroom. I am in the process of printing out all the poster sizes, laminating them, and then hanging them up as we cover each specific lesson! Such a great buy!"
♥ "I love these easy to read anchor charts and the feature that shrinks them to a printout/handout and a smartboard size."
♥ "These are so pretty, so in-depth (but simple at the same time) and make my walls look less bare. The kids LOVE having these up to help them with they homework or any questions they have. I love being able to point to the chart if they have questions and watch them realize that they don't always have to come to me!"
We also have Math Anchor Chart Bundles for:
Click here to FOLLOW US and get 50% off our new products for the first 24 hours.
Connect with us:
♥ Newsletter FREEBIES ♥ YouTube ♥ Facebook ♥ Instagram ♥ Pinterest ♥ Blog ♥
Purchasing this product grants permission for use by one teacher in his or her own classroom. If you intend to share with others, please purchase additional licenses at the discounted rate when you checkout.
We TRULY appreciate your purchase and remind you that leaving feedback earns you TpT credit toward future purchases! If you have any questions, please feel free to contact us.
Thanks so much!
Clint & Alyson Dowda


