Graphing Activity Bundle: Bar Graphs, Pictographs, Line Plots Digital Printable
- Zip
- Google Apps™

What educators are saying
Products in this Bundle (3)
Also included in
- Your students will love these engaging data and graphing activities for bar graphs, pictographs and line plots with fractions! No or low prep graphing worksheets, graphing games, and graphing assessments at your fingertips!Colorful graphing anchor charts for bar graphs, line plots and picture graphsPrice $21.70Original Price $31.95Save $10.25
Description
Your students will love these engaging data and graphing activities for bar graphs, pictographs and line plots! Printable graphing worksheets, anchor charts, and digital graphing activities are all ready for you in a snap to save you time!
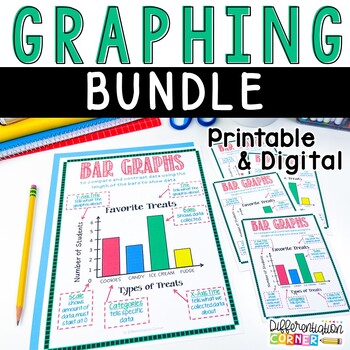
Colorful graphing anchor charts for bar graphs, line plots and picture graphs included in both large and small copies! Students will enjoy graphing practice with these differentiated graphing worksheets.
PRINTABLES-
✔Anchor Charts
Bar Graph
Pictograph / picture graph
Line Plot
All Graphs
✔Student copies of all anchor charts for interactive notebook entries
✔4 Bar Graph worksheets
✔4 Bar Graph worksheets where students make graph using provided data
✔4 Pictograph worksheets
✔4 Pictograph worksheets where students make graph using provided data
✔4 Line Plot worksheets
✔4 Line Plot worksheets where students make line plot using provided data Each student worksheet asks multi level questions meeting the common core standards.
DIGITAL-
- Interactive Google Slides copies of each printable worksheet
- Answer keys for slides
- 5 pages of instructions included for using this digital resource in the top educational apps (Google Drive, Microsoft OneDrive, Schoology, Notability, Nearpod, Canvas, Edmodo, Blackboard, Pic Collage, Padlet, Evernote and Seesaw).
These activities help children to understand how data can be displayed in various ways including pictographs, bar graphs, line plots and tally charts. They provide opportunities for data analysis and for children to create their own graphs and line plots. Tasks include reading and creating bar graphs, line plots and pictographs. Just print and go! No prep necessary!
______________________________________________________
TEACHERS LIKE YOU SAID…
⭐️⭐️⭐️⭐️⭐️Jason B. says “Good resource for students to learn about the parts of different types of graphs, answer questions using graphs, and create their own graphs. Will continue to use this resource in my classroom."
⭐️⭐️⭐️⭐️⭐️Staci F. says “These graphs were great to use during our Graphing Unit last spring. The color and topics made the assignments engaging to the students, and I was thrilled I didn't have to create them myself. I was glad that this resource had a variety of graphs to choose from too."
⭐️⭐️⭐️⭐️⭐️Lindsey L. says “My students find this very user friendly, as do I. Teaching pictographs and bar graphs during distance learning was a bit daunting, but this resource is AMAZING. It gives the students an opportunity to interpret graphs as well as create their own. It was easy to create video lessons and walk them through the process by doing example graphs as there are many for each type of graph."
⭐️⭐️⭐️⭐️⭐️Renee F. says “This was wonderful. Easy to use and hit all that I needed it to for the different graphs"
⭐️⭐️⭐️⭐️⭐️Meghan N. says “Lots of ways to use - can use the different slides to differentiate as well."
______________________________________________________
⭐Follow me for freebies, new products, and sales! All new products are 50% off for the first 48 hours!
______________________________________________________


