Graphing Practice and Data Analysis Activity Worksheet Set Scientific Method
Elevation Science
638 Followers
Grade Levels
7th - 10th
Subjects
Resource Type
Standards
NGSSMS-LS2-2
NGSSMS-LS2-4
NGSSHS-LS2-2
Formats Included
- Zip
- Easel Activity
Pages
14 pages
Elevation Science
638 Followers
Easel Activities Included
Some resources in this bundle include ready-to-use interactive activities that students can complete on any device. Easel by TPT is free to use! Learn more.
What educators are saying
Students loved this task. Well designed and easy for all abilities to engage with the content. Great for reviewing skills Before starting CBA time
I specifically used the juncos activity as an assessment. I love this set of activities! Thank you for an easy-to-implement resource!
Products in this Bundle (5)
Also included in
- SAVE 25% OFF LIST PRICES! Build foundational SCIENCE SKILLS such as experiment design, graphing, and data analysis! This bundle includes 8 worksheets that give your students structured support to practice these skills. Use in a scientific method unit, throughout the school year to reinforce skillPrice $17.99Original Price $24.00Save $6.01
Description
Save 33% OFF list prices! Build GRAPHING and DATA ANLAYSIS skills with these scaffolded worksheets. Each worksheet builds upon the last to grow student independence with graphing and data analysis. Students will graph and analyze scientifically meaningful data based on real-world research on wild birds. Instruction is built into the activities.
Please click VIEW PREVIEW (above) to see more detail of every included resource.
Students will practice the following skills in these activities:
- Making line and bar graphs, including choosing intervals, labeling axes, and writing graph titles.
- Pulling data from line and bar graphs.
- Data analysis that requires using data as evidence to support conclusions.
- Reinforcement of experimental design, such as determining independent and dependent variables, constants, and forming research questions.
The activities are scaffolded as follows:
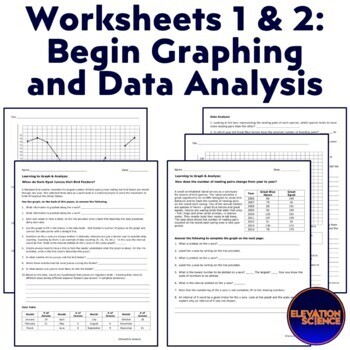
- Worksheets 1 (Juncos) and 2 (Herons): Designed to teach basic graphing and initiate thinking about experimental design and the meaning behind data.
- Worksheets 3 (Woodpeckers) and 4 (Hummingbirds): Provide additional practice with reduced scaffolding so skills learned in the first two lessons can be applied by the student.
- Worksheet 5 (Falcons): Provides the least scaffolding in graphing and can be used as a formative or summative assessment.
Teacher Notes:
- Please note that these resources are not editable.
- Answer keys included.
- Want even more SCIENCE SKILL BUILDING activities? Consider our EXPERIMENTAL DESIGN, GRAPHING, and DATA ANALYSIS BUNDLE!
Please consider clicking HERE to follow Elevation Science on TPT!
Total Pages
14 pages
Answer Key
Included
Teaching Duration
N/A
Report this resource to TPT
Reported resources will be reviewed by our team. Report this resource to let us know if this resource violates TPT’s content guidelines.
Standards
to see state-specific standards (only available in the US).
NGSSMS-LS2-2
Construct an explanation that predicts patterns of interactions among organisms across multiple ecosystems. Emphasis is on predicting consistent patterns of interactions in different ecosystems in terms of the relationships among and between organisms and abiotic components of ecosystems. Examples of types of interactions could include competitive, predatory, and mutually beneficial.
NGSSMS-LS2-4
Construct an argument supported by empirical evidence that changes to physical or biological components of an ecosystem affect populations. Emphasis is on recognizing patterns in data and making warranted inferences about changes in populations, and on evaluating empirical evidence supporting arguments about changes to ecosystems.
NGSSHS-LS2-2
Use mathematical representations to support and revise explanations based on evidence about factors affecting biodiversity and populations in ecosystems of different scales. Examples of mathematical representations include finding the average, determining trends, and using graphical comparisons of multiple sets of data. Assessment is limited to provided data.


