
Line Plots with Fractions Worksheets - Line Plot Activities for 4th & 5th Grade


- PDF
What educators are saying
Also included in
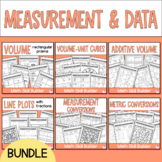 This measurement and data bundle includes printable practice pages to support your units on measurement conversions, line plots and volume. This bundle of 6 resources is perfect for practicing measurement and data standards and skills commonly covered in 5th grade. Save 20% when your purchase thesePrice $14.40Original Price $18.60Save $4.20
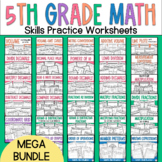 This 5th grade math bundle has over 200 worksheets with skills practice you can use as review, homework, test prep, assessments, math centers and more! Covers 5th grade math standards. Great practice for students and very low prep for teachers!**Save over 40% off the individual resource prices by puPrice $49.97Original Price $87.60Save $37.63
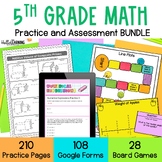 This bundle has everything you need for 5th grade math! Includes practice worksheets, math board games and assessments using Google Forms. Covers all the 5th grade math standards through easy to use and engaging activities!When you buy this bundle you are saving 45% off the price of the individual rPrice $135.63Original Price $246.60Save $110.97
Description
These line plots worksheets are a low prep way to help your students master working with line plots. Students will practice reading, creating and analyzing line plots with whole numbers and fractions. Great for extra practice, homework, review, small groups or interventions.
Click the PREVIEW button to see details of everything that is included!
⭐ This easy to use packet includes:
- 5 line plot worksheets
- 1 test prep multiple-choice sheet
- 1 fun activity practice sheet (color by number)
- Answer keys
Aligned to the standards, this packet provides seven different worksheets that give students practice with this skills in a variety of formats.
⭐ The line plot skills your students will practice include:
- reading and analyzing line plots with whole numbers
- reading and analyzing line plots with fractions
- creating and analyzing line plots with whole numbers
- creating and analyzing line plots with fractions
- redistribution of data on line plots (line plot redistribution)
- calculating mode, mean, median and range on a line plot
- calculating sums of values on a line plot
- test-prep - multiple choice questions
These activities can be used as whole group practice, homework, independent practice, review or center activities. Great as practice and reinforcement of 5.MD.2
You may also like my:
Measurement Conversions Task Cards - Metric
Measurement Conversions Task Cards - Customary
Measurement Conversion Worksheets - Customary
Measurement Conversion Worksheets - Metric
Follow me and be notified when new products are added to my store.
New products are always 50% off for the first 24 hours they are posted!
Thanks!
Dawn - Hello Learning
